

Question: Please provide a step by step solution prepare You are an administrator for Dollar Wise Financial Services and need to a chart that represents the
Please provide a step by step solution
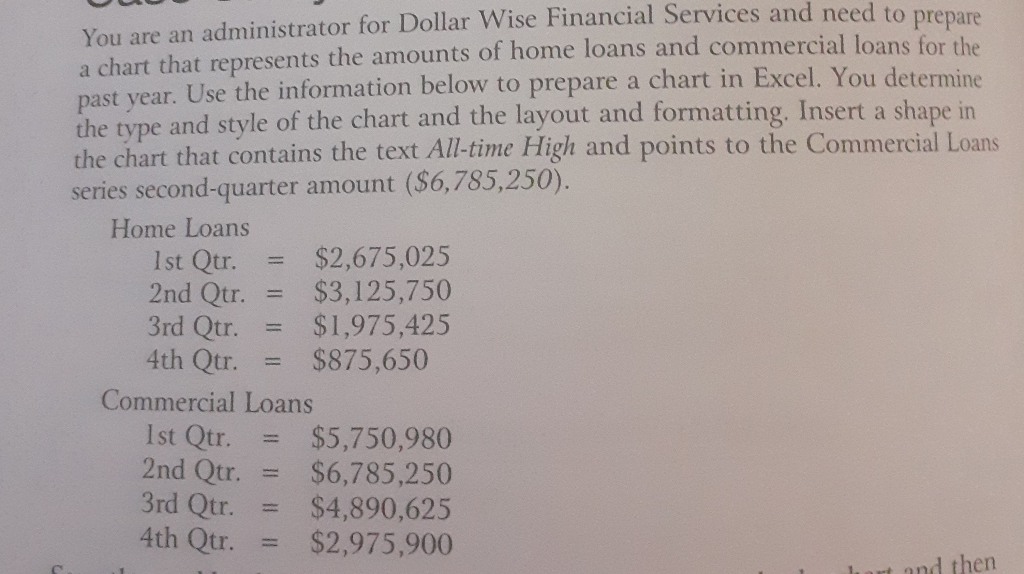
prepare You are an administrator for Dollar Wise Financial Services and need to a chart that represents the amounts of home loans and commercial loans for the past year. Use the information below to prepare a chart in Excel. You determine the type and style of the chart and the layout and formatting. Insert a shape in the chart that contains the text All-time High and points to the Commercial Loans series second-quarter amount ($6,785,250). Home Loans 1st Qtr. $2,675,025 2nd Qtr. $3,125,750 3rd Qtr. $1,975,425 4th Qtr. $875,650 Commercial Loans $5,750,980 $6,785,250 $4,890,625 $2,975,900 d then Ist Qtr. 2nd Qtr. 3rd Qtr. 4th Qtr
Step by Step Solution
There are 3 Steps involved in it

Get step-by-step solutions from verified subject matter experts