

Question: Please provide an accurate answer for each part with some useful explanation, thanks You have collected data on sales of leggings in each of the
Please provide an accurate answer for each part with some useful explanation, thanks
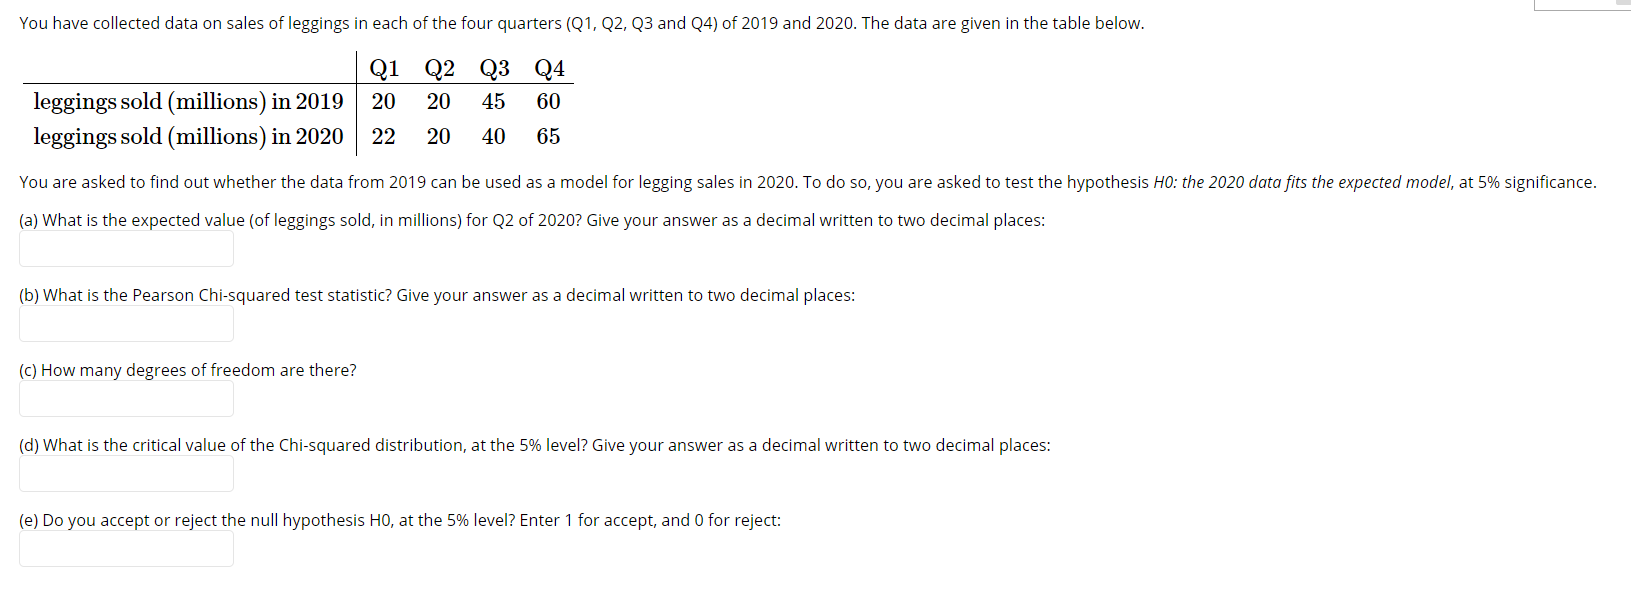
You have collected data on sales of leggings in each of the four quarters (Q1, Q2, Q3 and Q4) of 2019 and 2020. The data are given in the table below. Q1 Q2 Q3 Q4 leggings sold (millions) in 2019 20 20 45 60 leggings sold (millions) in 2020 22 20 40 65 You are asked to find out whether the data from 2019 can be used as a model for legging sales in 2020. To do so, you are asked to test the hypothesis HO: the 2020 data fits the expected model, at 5% significance. (a) What is the expected value (of leggings sold, in millions) for Q2 of 2020? Give your answer as a decimal written to two decimal places: (b) What is the Pearson Chi-squared test statistic? Give your answer as a decimal written to two decimal places: (c) How many degrees of freedom are there? (d) What is the critical value of the Chi-squared distribution, at the 5% level? Give your answer as a decimal written to two decimal places: (e) Do you accept or reject the null hypothesis HO, at the 5% level? Enter 1 for accept, and 0 for reject
Step by Step Solution
There are 3 Steps involved in it

Get step-by-step solutions from verified subject matter experts