

Question: Please provide an answer for the following with using the data below from years 2015-2020 PLEASE LET ME KNOW IF MORE INFO IS NEEDED BUT
Please provide an answer for the following with using the data below from years 2015-2020
PLEASE LET ME KNOW IF MORE INFO IS NEEDED BUT THIS IS ALL THE INFO I WAS GIVEN SO IF YOU CANT ANSWER IT PLEASE LEAVE THAT PORTION BLANK
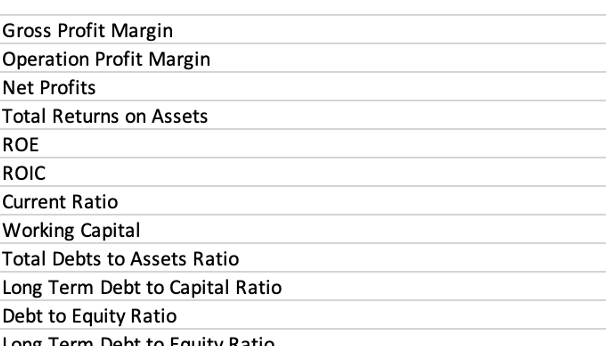
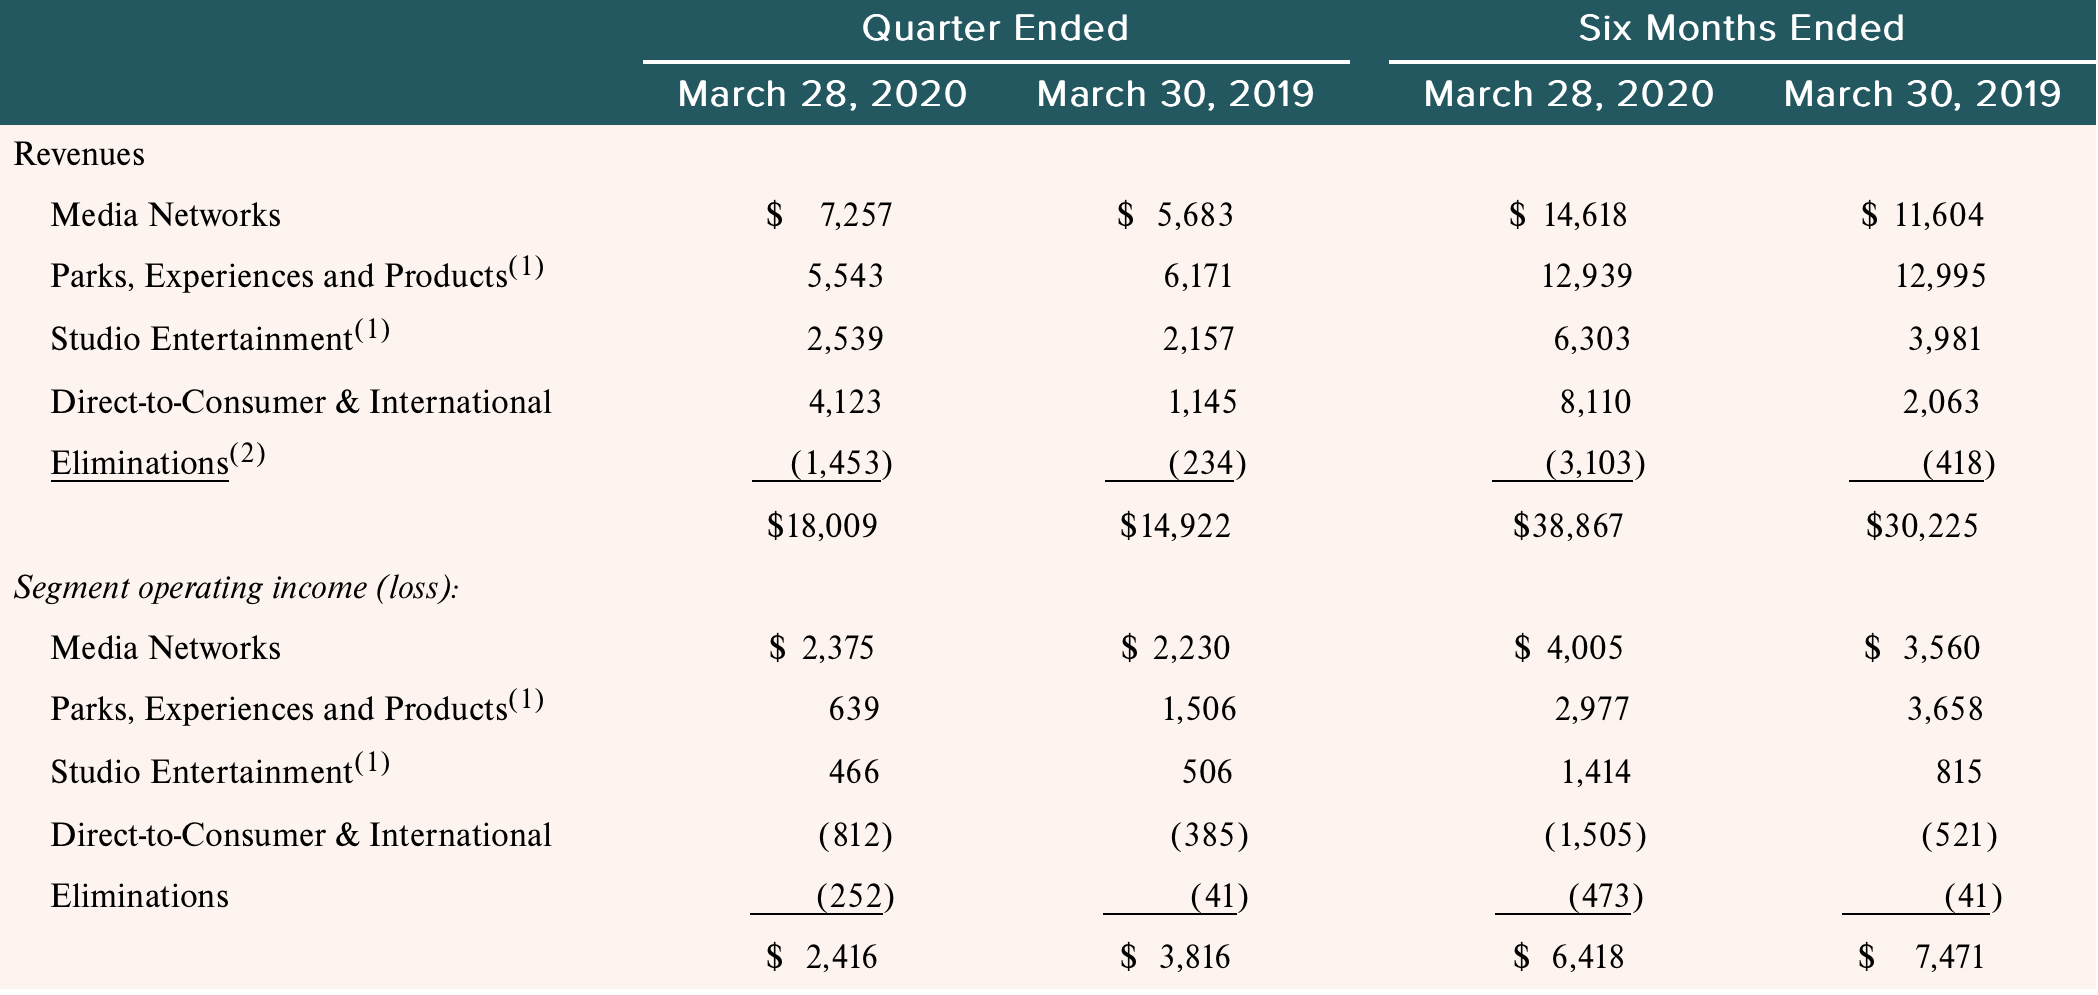
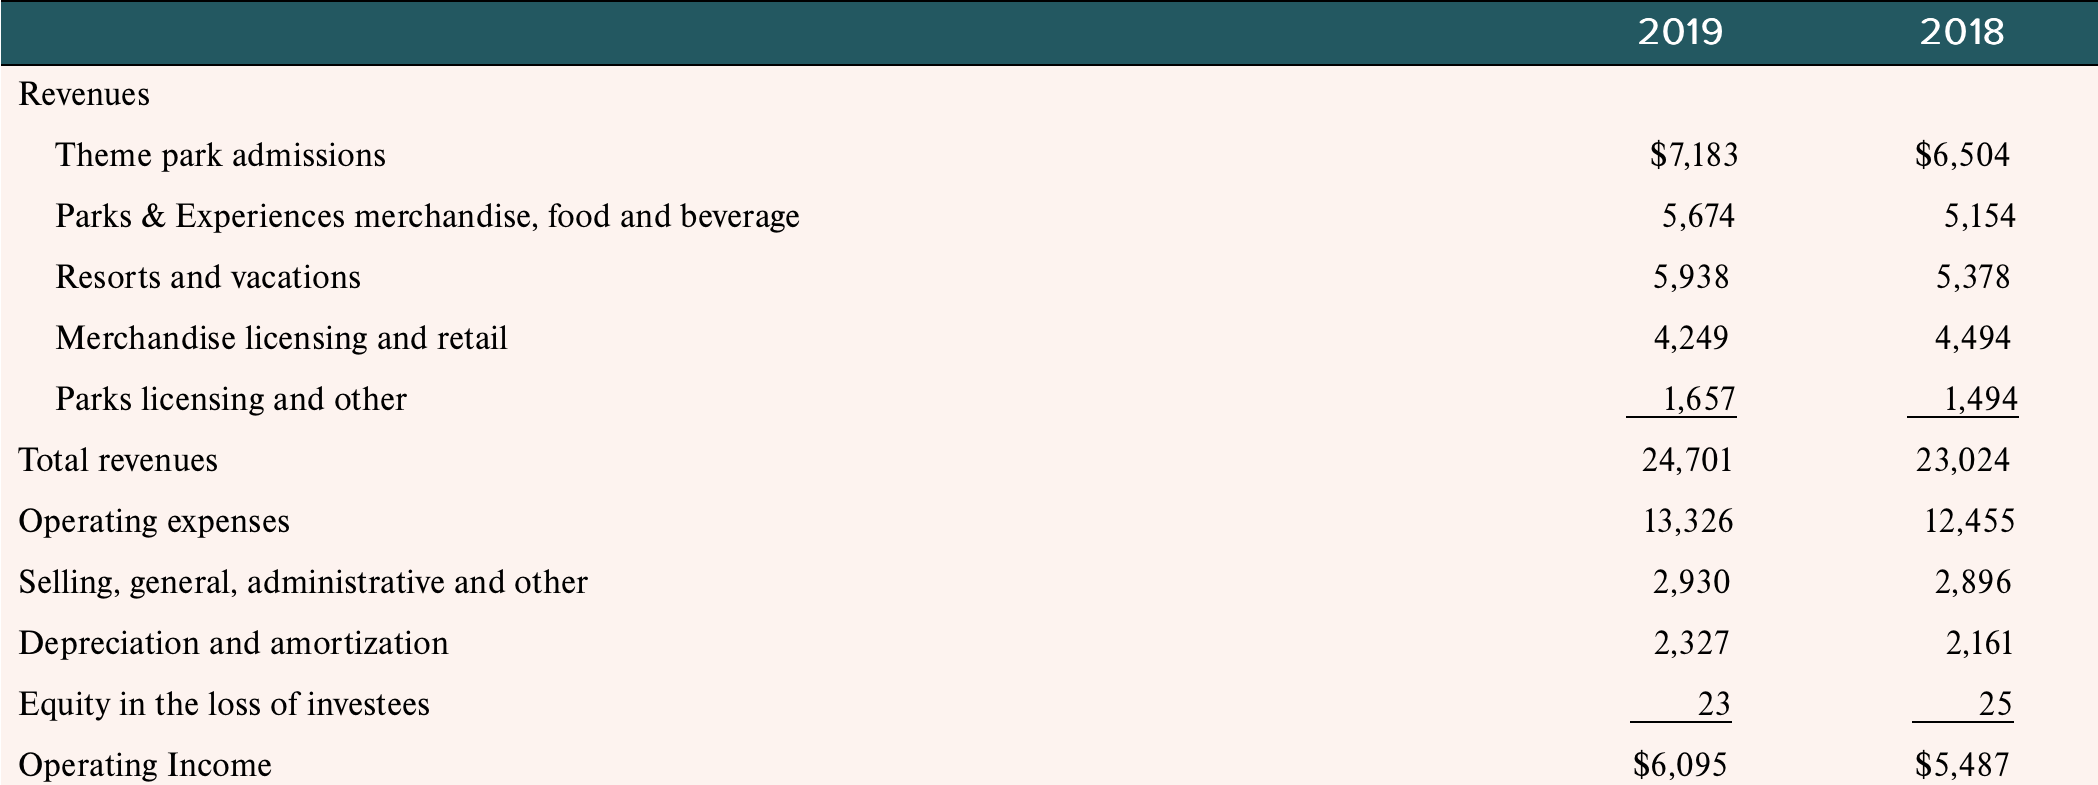
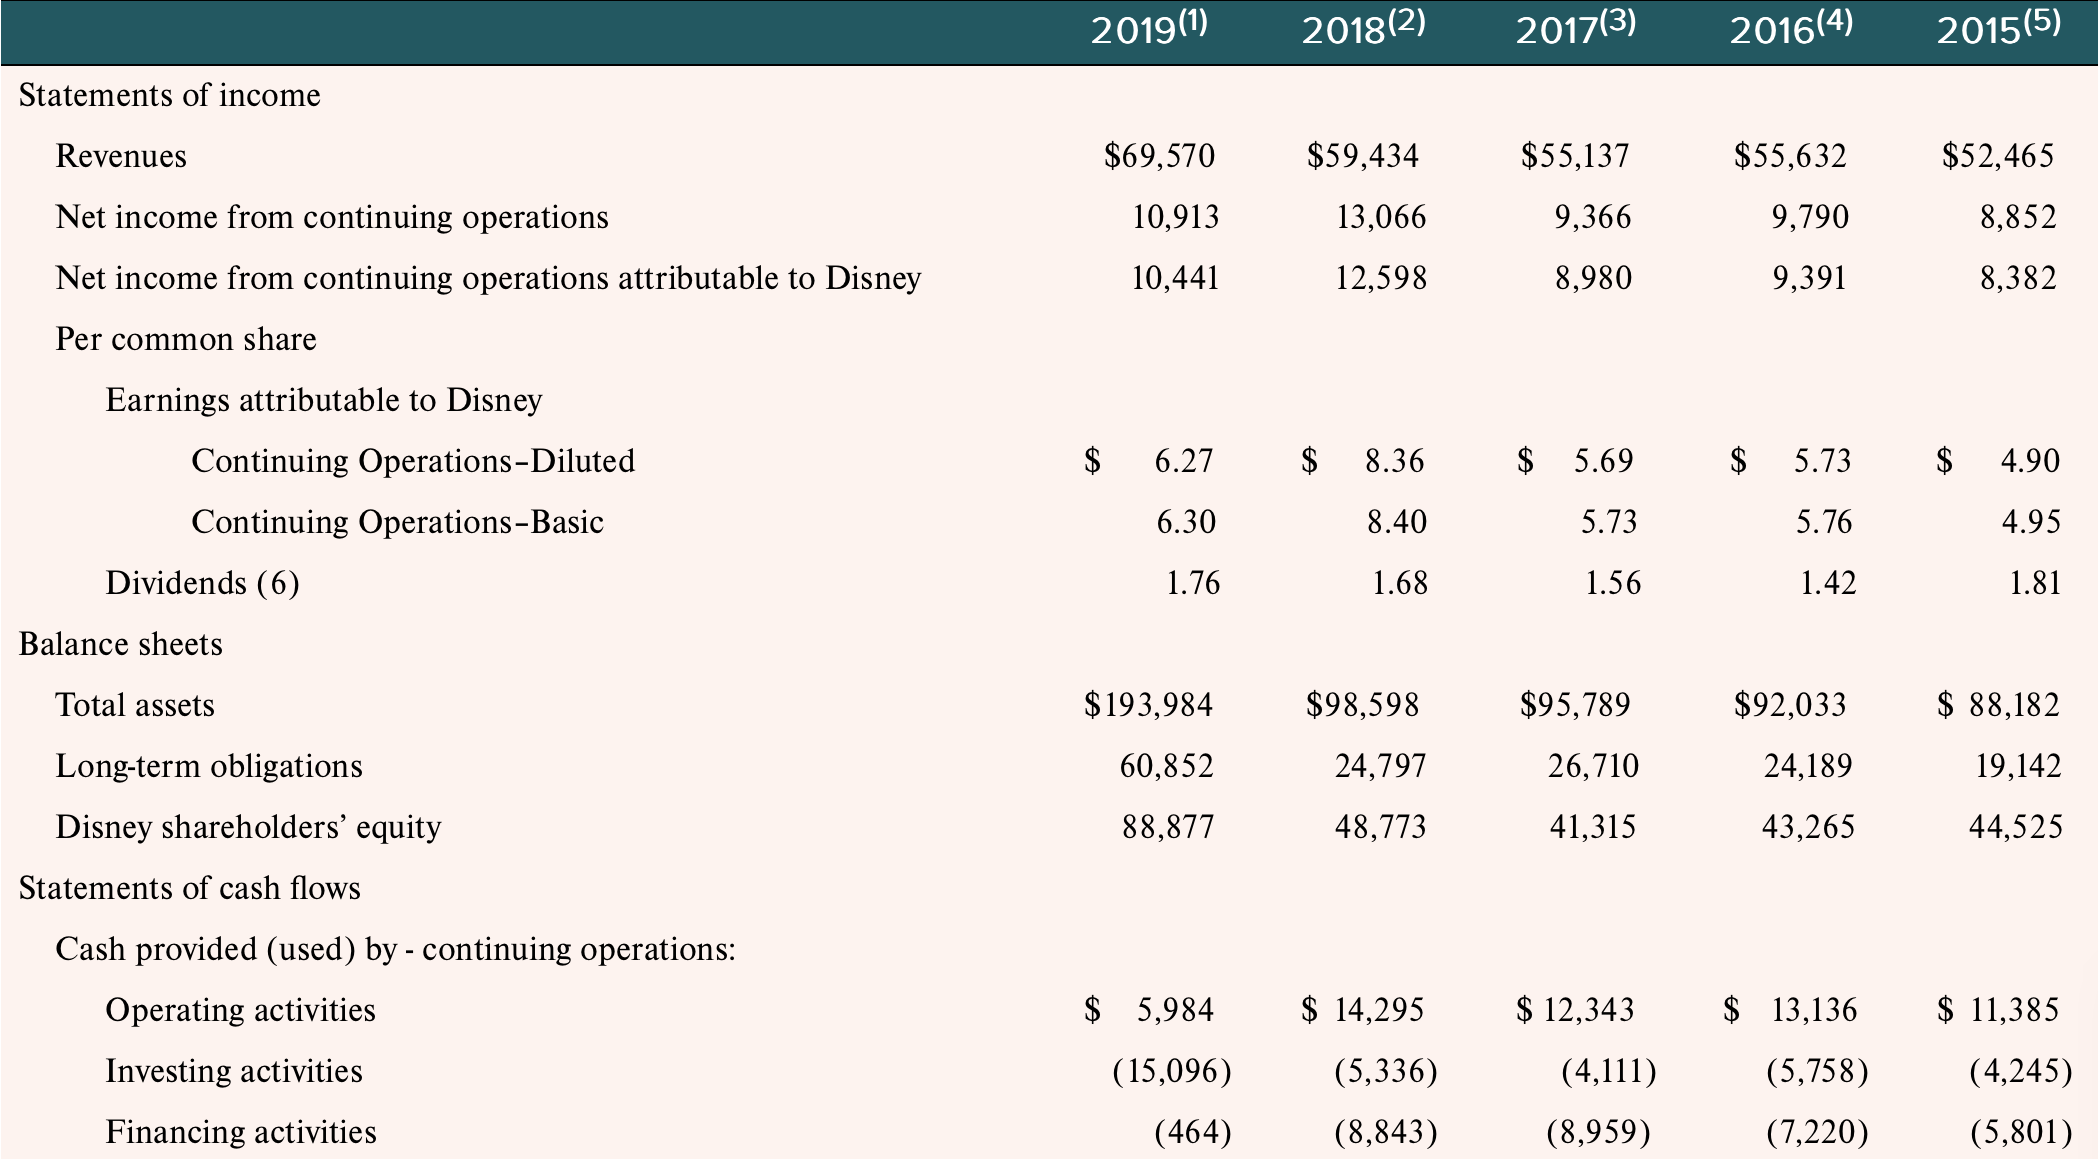
Quarter Ended Six Months Ended March 28, 2020 March 30, 2019 March 28, 2020 March 30, 2019 Revenues Media Networks Parks, Experiences and Products (1) Studio Entertainment (1) Direct-to-Consumer \& International Eliminations(2) Segment operating income (loss): Media Networks Parks, Experiences and Products (1) Studio Entertainment (1) Direct-to-Consumer \& International Eliminations $7,257 5,543 2,539 4,123 (1,453) $18,009 $2,375 639 466 (812) (252) $2,416 $5,683 6,171 2,157 1,145 (234) $14,922 $2,230 1,506 506 (385) (41) $3,816 $14,618 12,939 6,303 8,110 (3,103) $38,867 $4,005 2,977 1,414 (1,505) (473) $6,418 \$11,604 12,995 3,981 2,063 (418) $30,225 $3,560 3,658 815 (521) (41) (41) 7,471 \begin{tabular}{lrr} & 2019 & 2018 \\ \hline Revenues & & \\ Theme park admissions & $7,183 & $6,504 \\ Parks \& Experiences merchandise, food and beverage & 5,674 & 5,154 \\ Resorts and vacations & 5,938 & 5,378 \\ Merchandise licensing and retail & 4,249 & 4,494 \\ Parks licensing and other & 1,657 & 1,494 \\ \cline { 2 - 4 } Total revenues & 24,701 & 23,024 \\ Operating expenses & 13,326 & 12,455 \\ Selling, general, administrative and other & 2,930 & 2,896 \\ Depreciation and amortization & 2,327 & 2,161 \\ Equity in the loss of investees & 23 & 25 \\ Operating Income & $6,095 & $5,487 \end{tabular} Gross Profit Margin Operation Profit Margin Net Profits Total Returns on Assets ROE ROIC Current Ratio Working Capital Total Debts to Assets Ratio Long Term Debt to Capital Ratio Debt to Equity Ratio 2019(1)2018(2)2017(3)2016(4)2015(5) Statements of income Revenues Net income from continuing operations Net income from continuing operations attributable to Disney Per common share Earnings attributable to Disney Continuing Operations-Diluted Continuing Operations-Basic Dividends (6) Balance sheets Total assets Long-term obligations Disney shareholders' equity Statements of cash flows Cash provided (used) by - continuing operations: Operating activities Investing activities Financing activities \begin{tabular}{rrrrr} $69,570 & $59,434 & $55,137 & $55,632 & $52,465 \\ 10,913 & 13,066 & 9,366 & 9,790 & 8,852 \\ 10,441 & 12,598 & 8,980 & 9,391 & 8,382 \end{tabular} \begin{tabular}{|c|c|c|c|c|} \hline 6.27 & 8.36 & 5.69 & 5.73 & $ \\ \hline 6.30 & 8.40 & 5.73 & 5.76 & \\ \hline 1.76 & 1.68 & 1.56 & 1.42 & \\ \hline$193,984 & $98,598 & $95,789 & $92,033 & $ \\ \hline 60,852 & 24,797 & 26,710 & 24,189 & \\ \hline 88,877 & 48,773 & 41,315 & 43,265 & \\ \hline \end{tabular} \begin{tabular}{rrrrr} $5,984 & $14,295 & $12,343 & $13,136 & $11,385 \\ (15,096) & (5,336) & (4,111) & (5,758) & (4,245) \\ (464) & (8,843) & (8,959) & (7,220) & (5,801) \end{tabular}
Step by Step Solution
There are 3 Steps involved in it

Get step-by-step solutions from verified subject matter experts