

Question: Please provide an ratio analysis for the chart posted. Key Financial Ratios for Cantel Medical Corp Current Ratio Quick Ratio Total Debt-to-Total-Assets Ratio 7/31/2016 7/31/2017
 Please provide an ratio analysis for the chart posted.
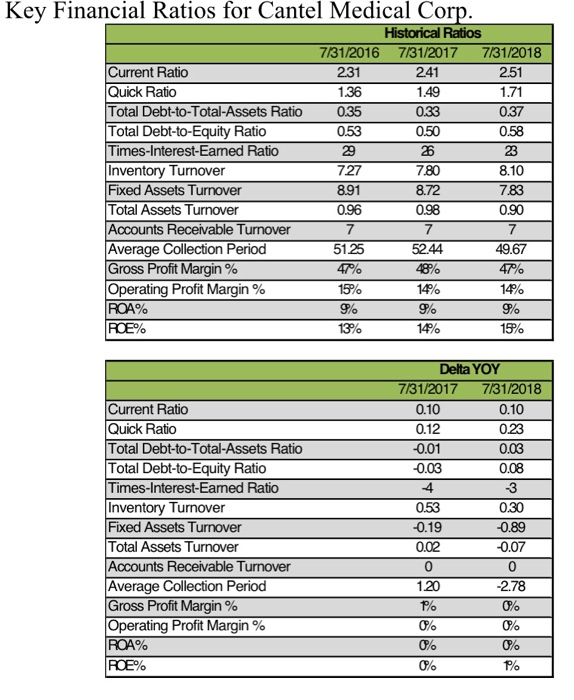
 Key Financial Ratios for Cantel Medical Corp Current Ratio Quick Ratio Total Debt-to-Total-Assets Ratio 7/31/2016 7/31/2017 7/31/2018 241 1.49 033 231 136 035 053 29 727 8.91 251 1.71 037 0.58 23 8.10 7.83 0.90 Times-Interest-Eamed Ratio Inventory Turnover Fixed Assets Turnover Total Assets Turnover Accounts Receivable Turnover Average Collection Period Gross Profit Margin % Operating Profit Margin % 26 780 8.72 7 51.25 7 5244 48% 14% 9% 14% 49.67 51%14% 0% 15% 14% 13% Delta YOY 7131/2017 7131/2018 0.10 023 0.03 0.08 -3 0.30 -0.89 0.07 0 -2.78 0% Current Ratio Quick Ratio Total Debt-to-Total-Assets Ratio 0.10 0.12 0.01 0.03 Times-Interest-Earned Ratio Inventory Turnover Fixed Assets Turnover Total Assets Turnover Accounts Receivable Turnover Average Collection Period Gross Profit Margin % Operating Profit Margin % 053 -0.19 0 120 0% 1%
Step by Step Solution
There are 3 Steps involved in it

Get step-by-step solutions from verified subject matter experts