

Question: please provide answer to question 2 and 3 Amanda, a local supermarket owner, has decided to use a more analytical approach to improve her store's
please provide answer to question 2 and 3
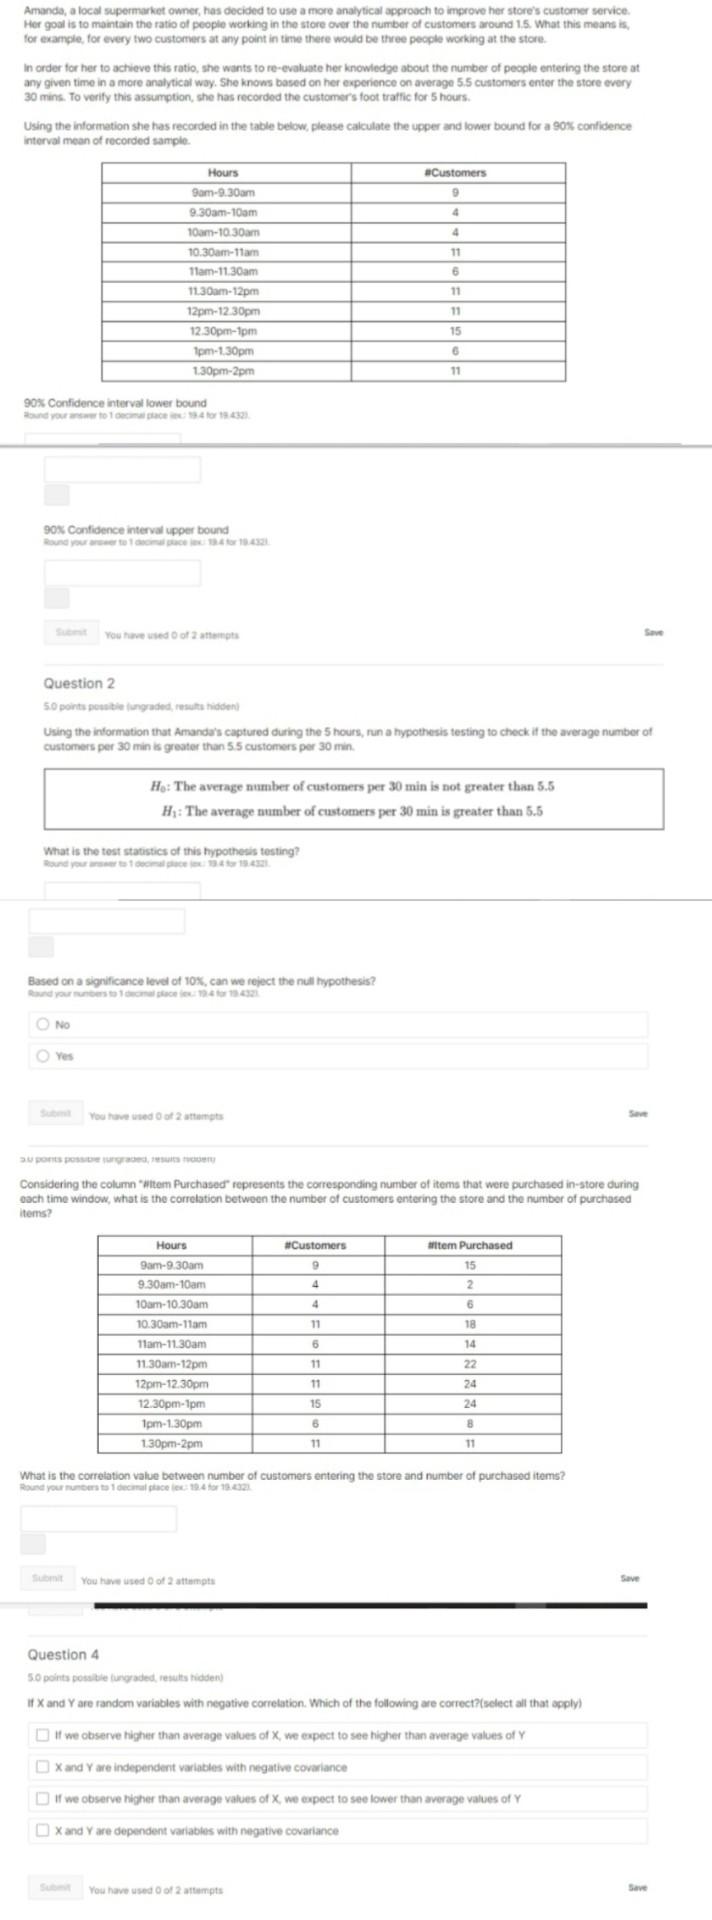
Amanda, a local supermarket owner, has decided to use a more analytical approach to improve her store's customer service Her goal is to maintain the ratio of people working in the store over the number of customers around 15. What this means is, for example, for every two customers at any point in time there would be three people working at the store. In order for her to achieve this ratio, she wants to re-evaluate her knowledge about the number of people entering the store at any given time in a more analytical way. She knows based on her experience on average 55 customers enter the store every 30 mins. To verify this assumption, she has recorded the customers foot traffic for 5 hours Using the information she has recorded in the table below, please calculate the upper and lower bound for a 90% confidence , interval mean of recorded sample. Customers 9 4 4 11 Hours Sam-9.30am 9.30am-10am 10am-10.30am 10.30am-11am Tam-11.30am 11.30am-12pm 12pm-12.30pm 12.30pm-1pm 1pm-1.30pm 1.30pm-2pm 6 11 11 15 6 11 90% Confidence interval lower bound Found you to make 3333 90% Confidence interval upper bound You need of 2 Save Question 2 5.0 points possibile ungraded results hidden Using the information that Amanda's captured during the 5 hours, run a hypothesis testing to check if the average number of customers per 30 min is greater than 55 customers per 30 min He: The average number of customers per 30 min is not greater than 5.5 H,: The average mmber of customers per 30 min is greater than 5.5 What is the test statistics of this hypothesis testing? Based on a significance level of 10%, can we reject the null hypothesis? and your No Yes You have woed of stats 2 U pont Considering the column witem Purchased represents the corresponding number of items that were purchased in-store during each time window, what is the correlation between the number of customers entering the store and the number of purchased items? #Customers 9 item Purchased 15 4 2 6 4 11 Hours Sam-9.30am 9.30am-10am 10am-10.30am 10.30am-11am 11am-11.30am 11.30am-12pm 12pm-12.30pm 12.30pm-1pm 1pm-1.30pm 1.30pm-2pm 18 14 6 11 22 24 11 15 24 8 8 11 11 What is the correlation value between number of customers entering the store and number of purchased items? Round your decalce19.41 Submit you have used of 2 temps Question 4 4 5.0 points possibile traded results hidden If X and Y are random variables with negative correlation. Which of the following are correct?(select all that apply If we observe higher than average values of X, we expect to see higher than average values of Y X and Yare independent variables with negative covariance If we observe higher than average values of X, we expect to see lower than average values of Y X and Y e dependent variables with negative covariance You have used of 2 ampts SaveStep by Step Solution
There are 3 Steps involved in it
1 Expert Approved Answer
Step: 1 Unlock

Question Has Been Solved by an Expert!
Get step-by-step solutions from verified subject matter experts
Step: 2 Unlock
Step: 3 Unlock