

Question: Please provide answer to the above scenario analysis with an excel sheet. 65.8% averaged percentage of sales from 2012 to 2014 8.9% averaged percentage of
Please provide answer to the above scenario analysis with an excel sheet.
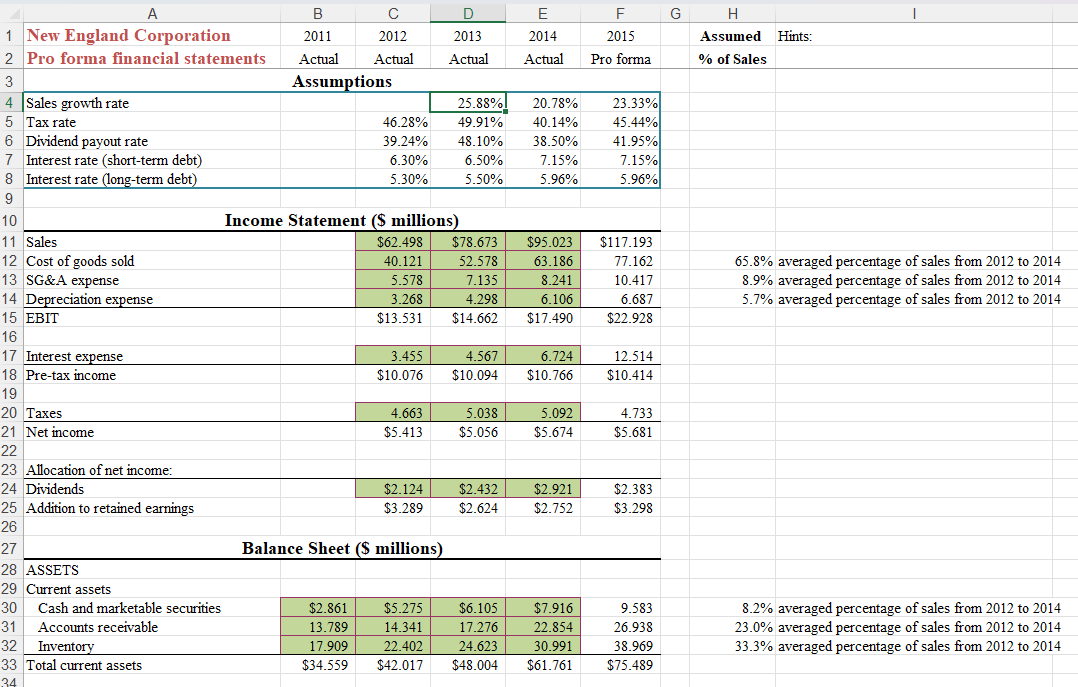
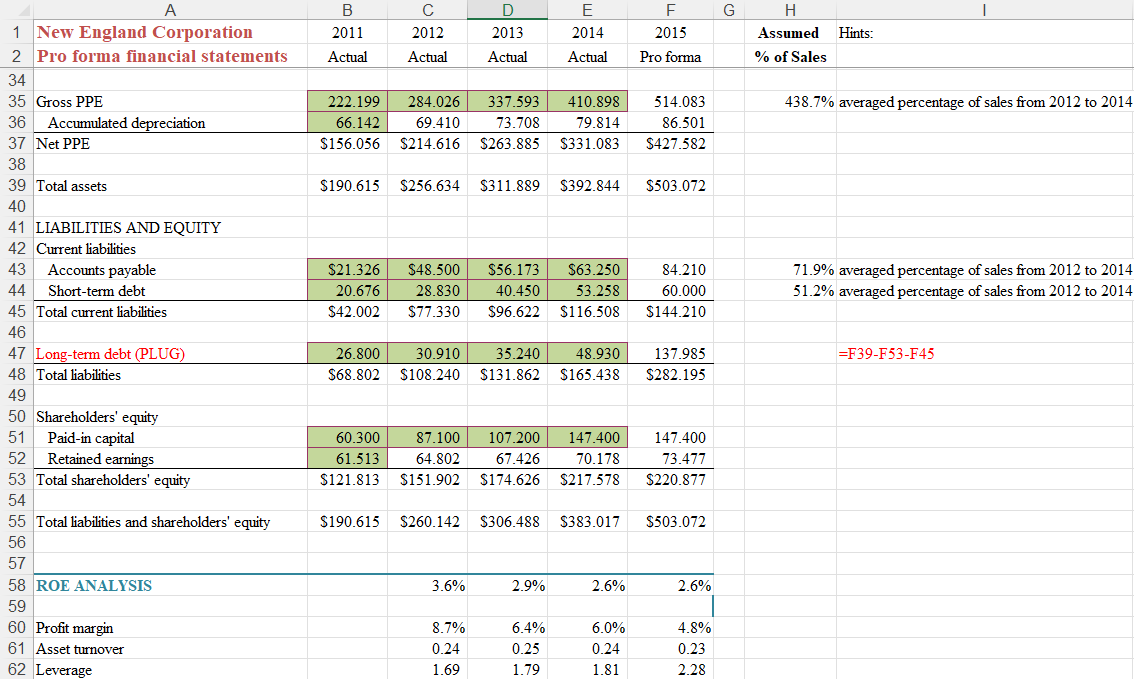
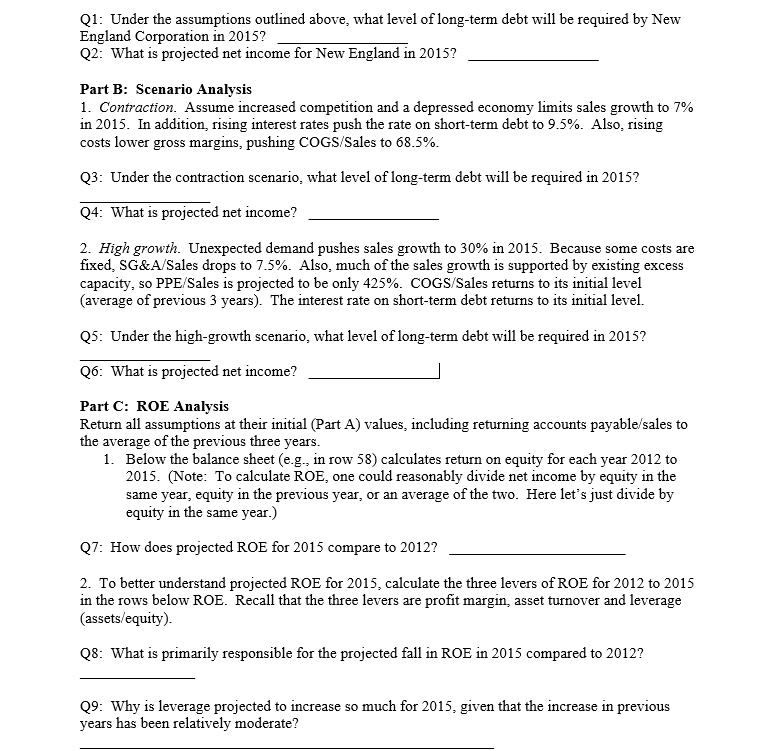
65.8% averaged percentage of sales from 2012 to 2014 8.9% averaged percentage of sales from 2012 to 2014 5.7% averaged percentage of sales from 2012 to 2014 Q1: Under the assumptions outlined above, what level of long-term debt will be required by New England Corporation in 2015? Q2: What is projected net income for New England in 2015 ? Part B: Scenario Analysis 1. Contraction. Assume increased competition and a depressed economy limits sales growth to 7% in 2015. In addition, rising interest rates push the rate on short-term debt to 9.5%. Also, rising costs lower gross margins, pushing COGS/Sales to 68.5%. Q3: Under the contraction scenario, what level of long-term debt will be required in 2015 ? Q4: What is projected net income? 2. High growth. Unexpected demand pushes sales growth to 30% in 2015 . Because some costs are fixed, SG\&A/Sales drops to 7.5\%. Also, much of the sales growth is supported by existing excess capacity, so PPE/Sales is projected to be only 425%. COGS/Sales returns to its initial level (average of previous 3 years). The interest rate on short-term debt returns to its initial level. Q5: Under the high-growth scenario, what level of long-term debt will be required in 2015 ? Q6: What is projected net income? Part C: ROE Analysis Return all assumptions at their initial (Part A) values, including returning accounts payable/sales to the average of the previous three years. 1. Below the balance sheet (e.g., in row 58) calculates return on equity for each year 2012 to 2015. (Note: To calculate ROE, one could reasonably divide net income by equity in the same year, equity in the previous year, or an average of the two. Here let's just divide by equity in the same year.) Q7: How does projected ROE for 2015 compare to 2012 ? 2. To better understand projected ROE for 2015 , calculate the three levers of ROE for 2012 to 2015 in the rows below ROE. Recall that the three levers are profit margin, asset turnover and leverage (assets/equity). Q8: What is primarily responsible for the projected fall in ROE in 2015 compared to 2012 ? Q9: Why is leverage projected to increase so much for 2015 , given that the increase in previous years has been relatively moderate? 65.8% averaged percentage of sales from 2012 to 2014 8.9% averaged percentage of sales from 2012 to 2014 5.7% averaged percentage of sales from 2012 to 2014 Q1: Under the assumptions outlined above, what level of long-term debt will be required by New England Corporation in 2015? Q2: What is projected net income for New England in 2015 ? Part B: Scenario Analysis 1. Contraction. Assume increased competition and a depressed economy limits sales growth to 7% in 2015. In addition, rising interest rates push the rate on short-term debt to 9.5%. Also, rising costs lower gross margins, pushing COGS/Sales to 68.5%. Q3: Under the contraction scenario, what level of long-term debt will be required in 2015 ? Q4: What is projected net income? 2. High growth. Unexpected demand pushes sales growth to 30% in 2015 . Because some costs are fixed, SG\&A/Sales drops to 7.5\%. Also, much of the sales growth is supported by existing excess capacity, so PPE/Sales is projected to be only 425%. COGS/Sales returns to its initial level (average of previous 3 years). The interest rate on short-term debt returns to its initial level. Q5: Under the high-growth scenario, what level of long-term debt will be required in 2015 ? Q6: What is projected net income? Part C: ROE Analysis Return all assumptions at their initial (Part A) values, including returning accounts payable/sales to the average of the previous three years. 1. Below the balance sheet (e.g., in row 58) calculates return on equity for each year 2012 to 2015. (Note: To calculate ROE, one could reasonably divide net income by equity in the same year, equity in the previous year, or an average of the two. Here let's just divide by equity in the same year.) Q7: How does projected ROE for 2015 compare to 2012 ? 2. To better understand projected ROE for 2015 , calculate the three levers of ROE for 2012 to 2015 in the rows below ROE. Recall that the three levers are profit margin, asset turnover and leverage (assets/equity). Q8: What is primarily responsible for the projected fall in ROE in 2015 compared to 2012 ? Q9: Why is leverage projected to increase so much for 2015 , given that the increase in previous years has been relatively moderate
Step by Step Solution
There are 3 Steps involved in it

Get step-by-step solutions from verified subject matter experts