

Question: Please provide both plots that are asked in the question and answer accordingly. Using the information given in Figure 3.3 of the textbook (also shown
Please provide both plots that are asked in the question and answer accordingly.
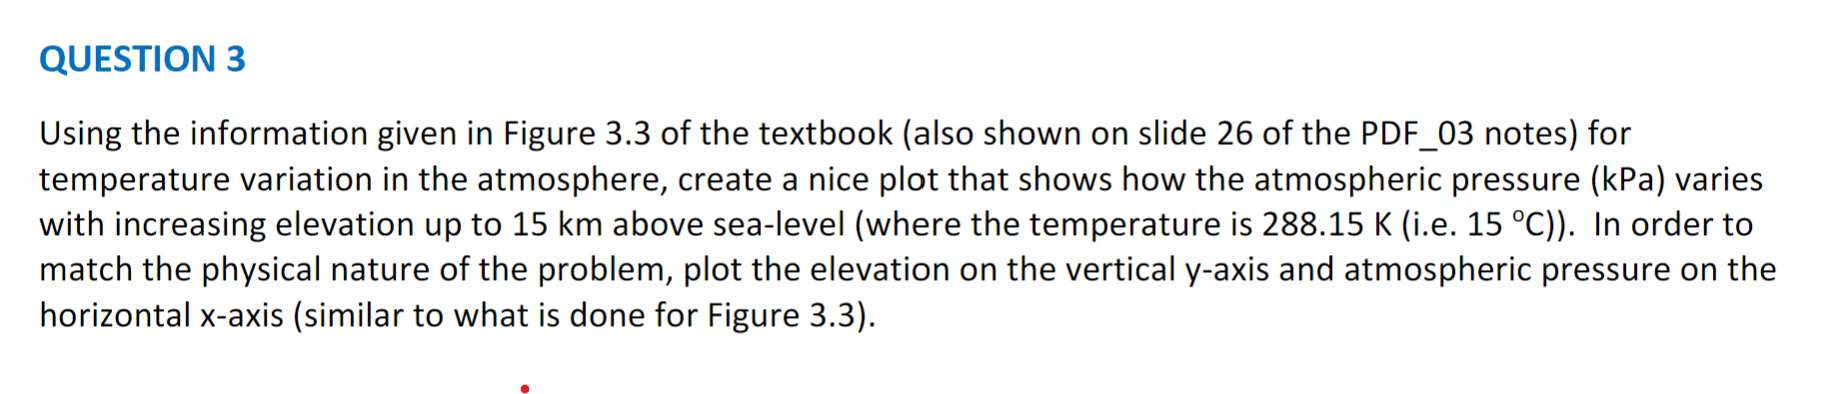
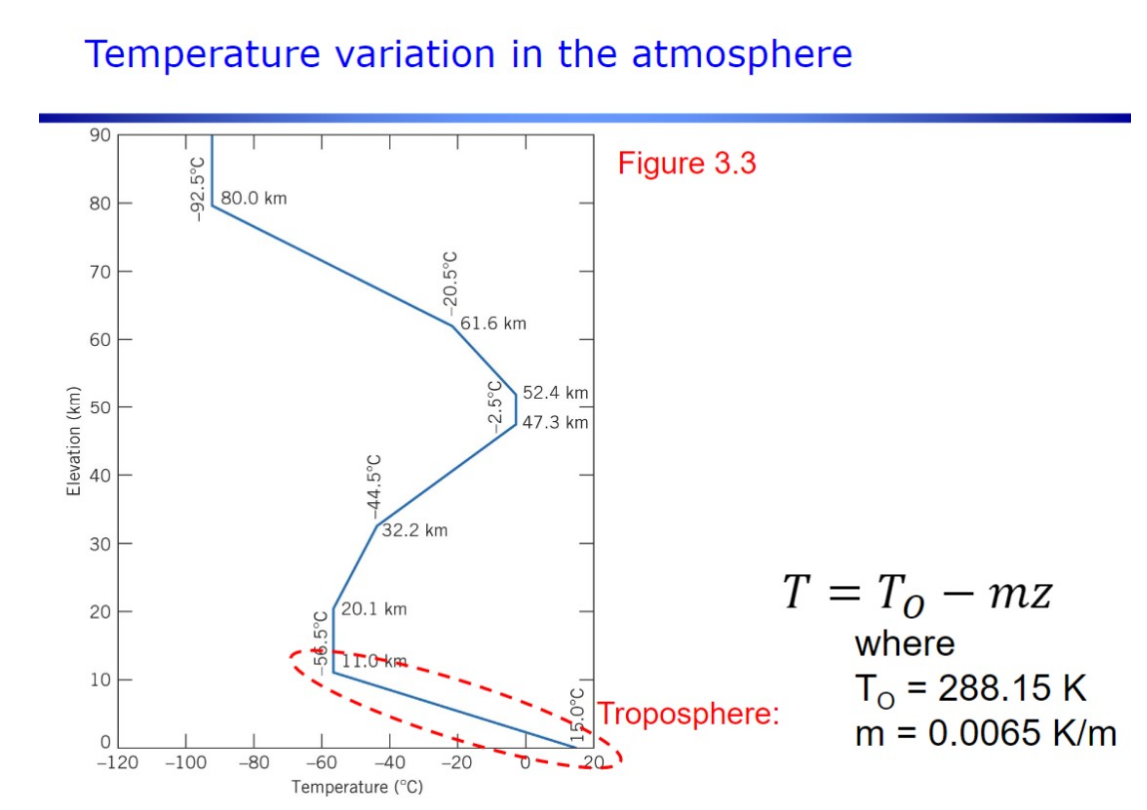
Using the information given in Figure 3.3 of the textbook (also shown on slide 26 of the PDF_03 notes) for temperature variation in the atmosphere, create a nice plot that shows how the atmospheric pressure ( kPa) varies with increasing elevation up to 15km above sea-level (where the temperature is 288.15K (i.e. 15C )). In order to match the physical nature of the problem, plot the elevation on the vertical y-axis and atmospheric pressure on the horizontal x-axis (similar to what is done for Figure 3.3). Temperature variation in the atmosphere ure 3.3 T=TOmz where osphere: TO=288.15Km=0.0065K/m
Step by Step Solution
There are 3 Steps involved in it

Get step-by-step solutions from verified subject matter experts