

Question: Please provide complete solution. Thank You. 1. Given 3 students in a Statistics class. Compare their scores if in a series of 6 quizzes, their


Please provide complete solution. Thank You.
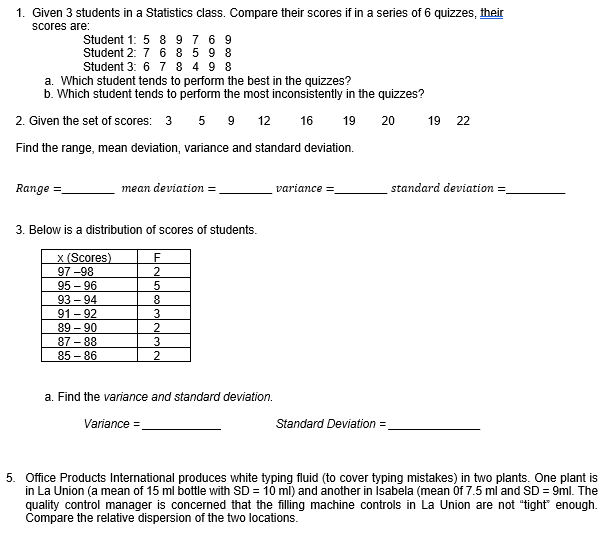
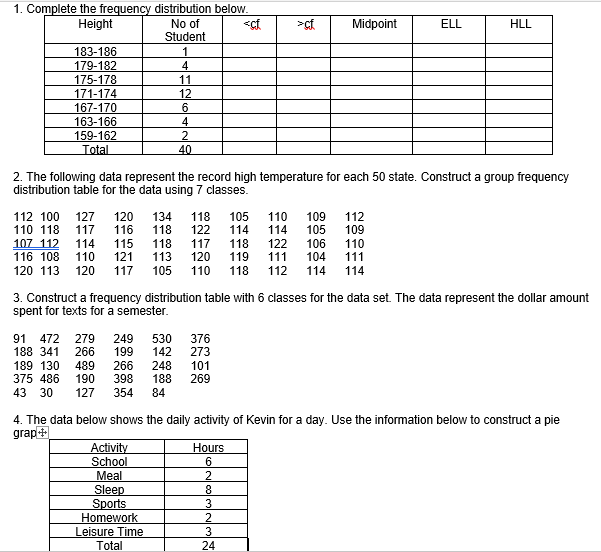
1. Given 3 students in a Statistics class. Compare their scores if in a series of 6 quizzes, their scores are: Student 1: 5 8 9 7 6 9 co to Student 2: 7 6 8 5 Student 3: 6 7 8 4 9 8 a. Which student tends to perform the best in the quizzes? b. Which student tends to perform the most inconsistently in the quizzes? 2. Given the set of scores: 3 5 9 12 16 19 20 19 22 Find the range, mean deviation, variance and standard deviation. Range = mean deviation = variance = standard deviation = 3. Below is a distribution of scores of students. x (Scores) 97 -98 95 -96 93 -94 N W N W O G NT 91 -92 89 - 90 87 - 88 85 - 86 a. Find the variance and standard deviation. Variance = Standard Deviation = 5. Office Products International produces white typing fluid (to cover typing mistakes) in two plants. One plant is in La Union (a mean of 15 ml bottle with SD = 10 ml) and another in Isabela (mean Of 7.5 ml and SD = 9ml. The quality control manager is concerned that the filling machine controls in La Union are not "tight" enough. Compare the relative dispersion of the two locations.1. Complete the frequency distribution below. Height No of
Step by Step Solution
There are 3 Steps involved in it

Get step-by-step solutions from verified subject matter experts