

Question: Please provide complete work for problem please. 2. Table below summarizes the result of a survey over all Target stores in the US, and it

Please provide complete work for problem please.
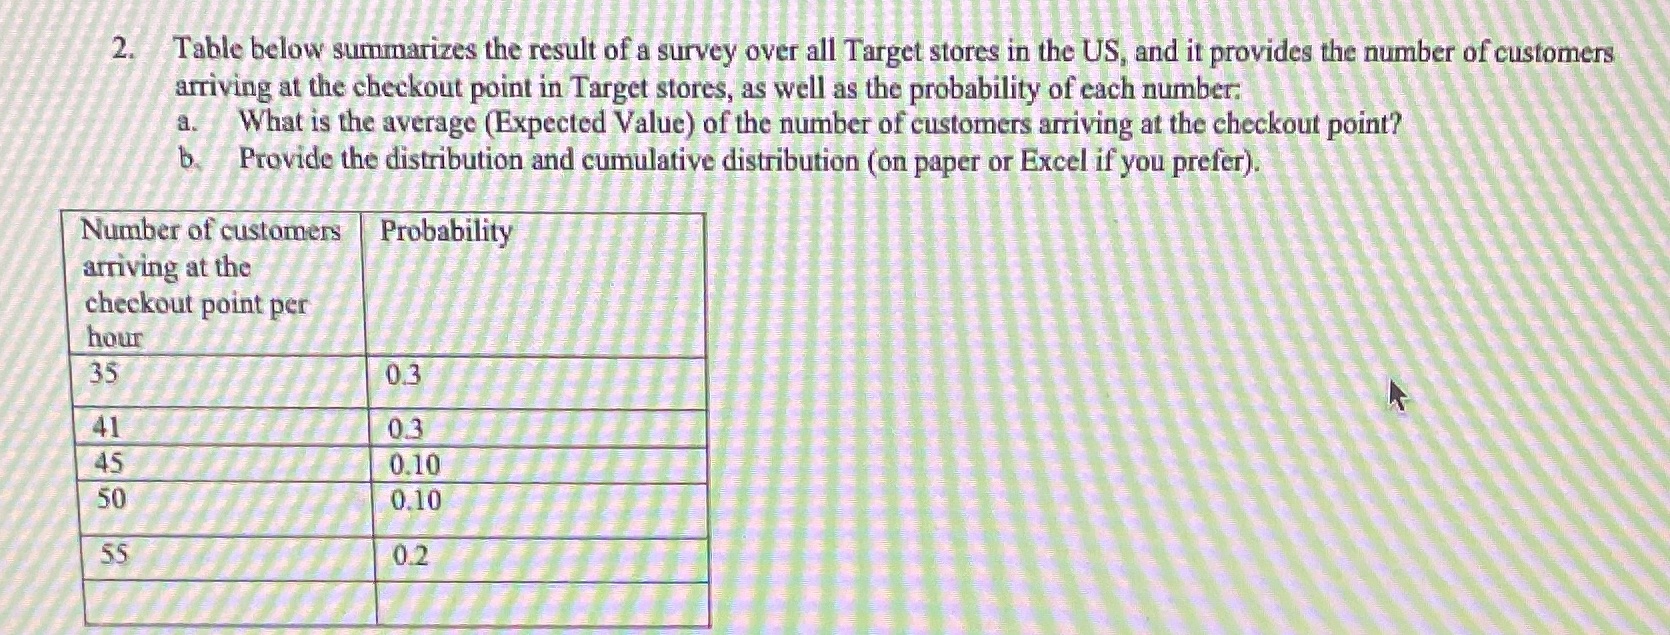
2. Table below summarizes the result of a survey over all Target stores in the US, and it provides the number of customers arriving at the checkout point in Target stores, as well as the probability of each number. a. What is the average (Expected Value) of the number of customers arriving at the checkout point? b.Provide the distribution and cumulative distribution (on paper or Excel if you prefer). Number of customers Probability arriving at the checkout point per hour 35 0.3 41 03 45 0.10 50 0.10 55 0.2
Step by Step Solution
There are 3 Steps involved in it
1 Expert Approved Answer
Step: 1 Unlock

Question Has Been Solved by an Expert!
Get step-by-step solutions from verified subject matter experts
Step: 2 Unlock
Step: 3 Unlock