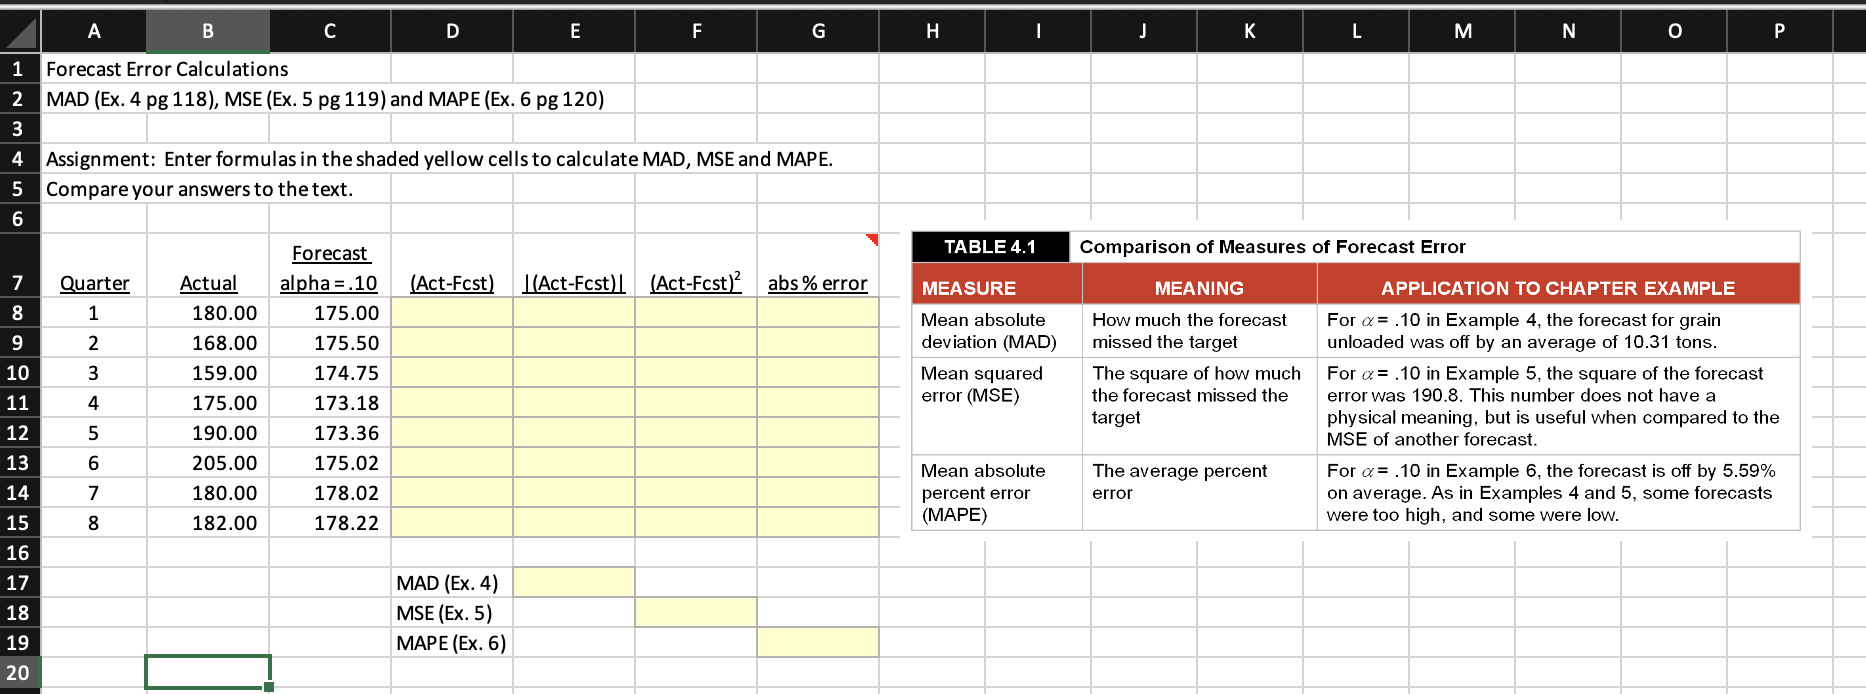
Question: please provide equations A B C D E F G I J L M N 0 P 1 Forecast Error Calculations 2 MAD (Ex. 4

please provide equations A B C D E F G I J L M Nplease provide equations

A B C D E F G I J L M N 0 P 1 Forecast Error Calculations 2 MAD (Ex. 4 pg 118), MSE (Ex. 5 pg 119) and MAPE (Ex. 6 pg 120) 3 4 Assignment: Enter formulas in the shaded yellow cells to calculate MAD, MSE and MAPE. 5 Compare your answers to the text. 6 TABLE 4.1 Comparison of Measures of Forecast Error 7 (Act-Fcst) |(Act-Fcst)| (Act-Fcst) abs % error MEASURE MEANING Quarter 1 8 9 10 11 12 13 Forecast alpha = .10 175.00 175.50 174.75 173.18 173.36 175.02 178.02 178.22 Actual 180.00 168.00 159.00 175.00 190.00 205.00 180.00 182.00 Mean absolute deviation (MAD) Mean squared error (MSE) 00 O W NP 4 How much the forecast missed the target The square of how much the forecast missed the target APPLICATION TO CHAPTER EXAMPLE For a= .10 in Example 4, the forecast for grain unloaded was off by an average of 10.31 tons. For a= .10 in Example 5, the square of the forecast error was 190.8. This number does not have a physical meaning, but is useful when compared to the MSE of another forecast. For a= .10 in Example 6, the forecast is off by 5.59% on average. As in Examples 4 and 5, some forecasts were too high, and some were low. 5 The average percent error 14 Mean absolute percent error (MAPE) 7 15 16 17 18 19 MAD (Ex. 4) MSE (Ex. 5) MAPE (Ex. 6) 20

Step by Step Solution

There are 3 Steps involved in it

1 Expert Approved Answer
Step: 1 Unlock blur-text-image
Question Has Been Solved by an Expert!

Get step-by-step solutions from verified subject matter experts

Step: 2 Unlock
Step: 3 Unlock

Students Have Also Explored These Related General Management Questions!