

Question: Please provide excel functions for excel A local dealership took a sample of cars that were recently traded in to determine the average length of
Please provide excel functions for excel
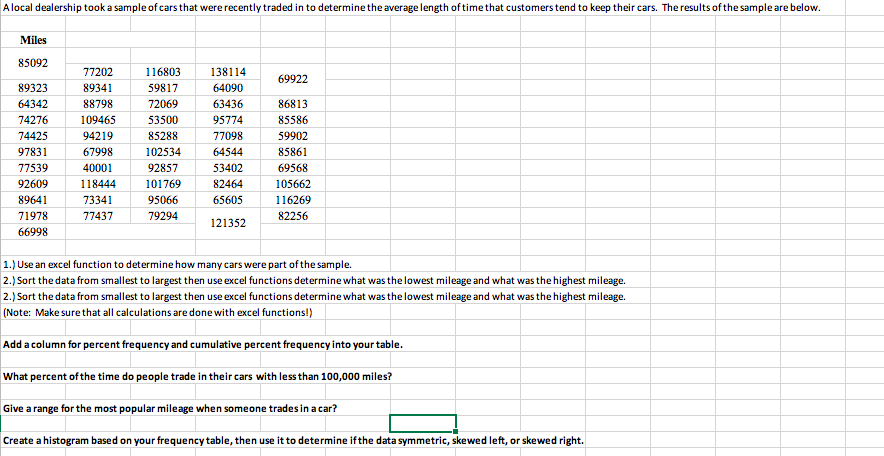
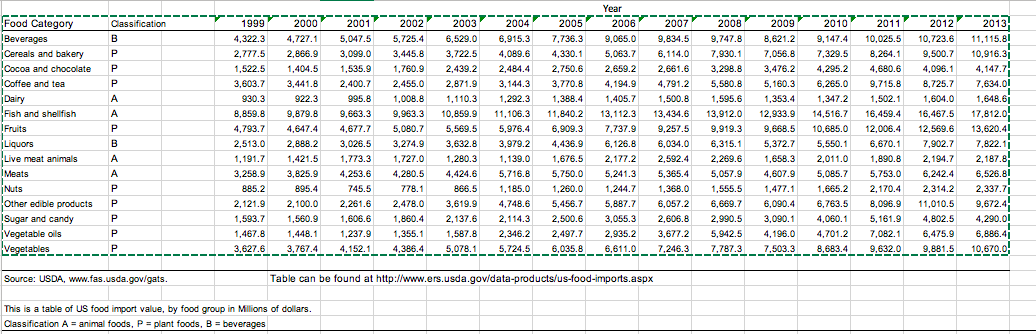
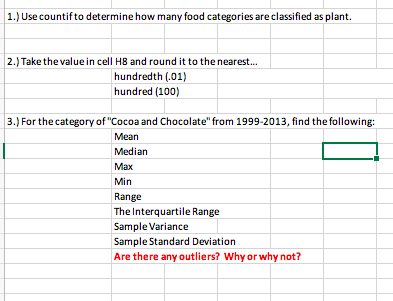
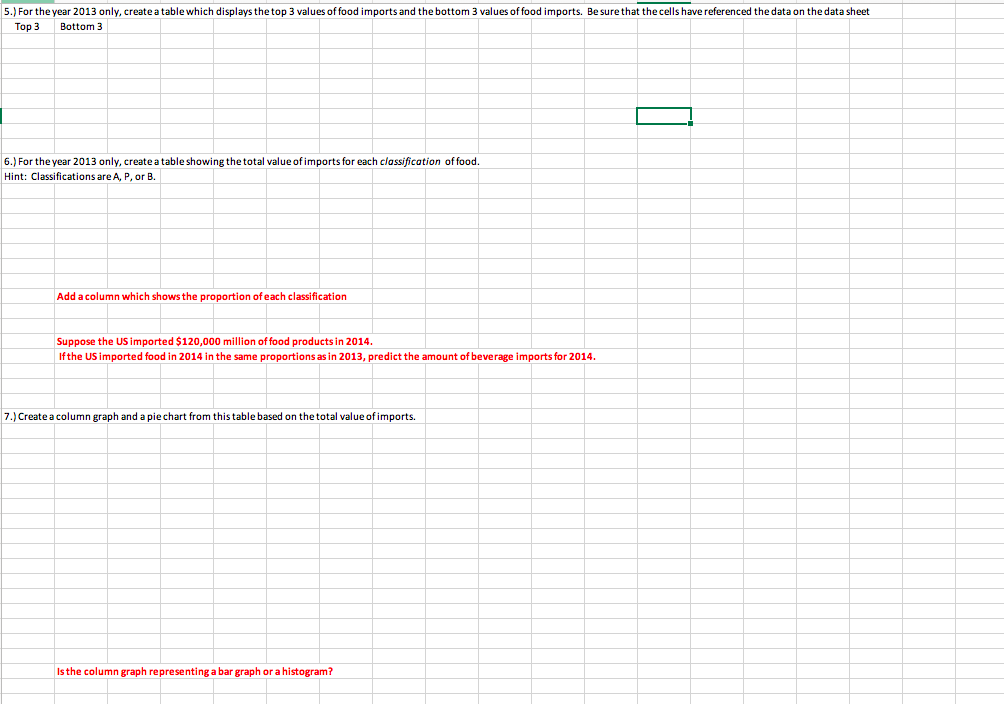
A local dealership took a sample of cars that were recently traded in to determine the average length of time that customers tend to keep their cars. The results of the sample are below. Miles 85092 77202 116803 138114 89323 89341 59817 64090 69922 64342 88798 72069 63436 86813 74276 109465 53500 95774 85586 74425 94219 85288 77098 59902 97831 67998 102534 64544 85861 77539 40001 92857 53402 69568 92609 118444 101769 82464 105662 89641 73341 95066 65605 116269 71978 77437 79294 66998 121352 82256 1.) Use an excel function to determine how many cars were part of the sample. 2.) Sort the data from smallest to largest then use excel functions determine what was the lowest mileage and what was the highest mileage. 2.) Sort the data from smallest to largest then use excel functions determine what was the lowest mileage and what was the highest mileage. (Note: Make sure that all calculations are done with excel functions!) Add a column for percent frequency and cumulative percent frequency into your table. What percent of the time do people trade in their cars with less than 100,000 miles? Give a range for the most popular mileage when someone trades in a car? Create a histogram based on your frequency table, then use it to determine if the data symmetric, skewed left, or skewed right.Food Category Classification 1999 2000 2001 2002 2003 2004 2005 2006 2007 2008 2009 2010 2011 2012 2013 Beverages B 4,322.3 4,727.1 5,047.5 5,725.4 6,529.0 6,915.3 7,736.3 9,065.0 9,834.5 9,747.8 8,621.2 9,147.4 10,025.5 10,723.6 11, 115.81 Cereals and bakery P 2,777.5 2,866.9 3,099.0 3,445.8 3,722.5 4,089.6 4,330.1 5,063.7 6,114.0 7,930.1 7,056.8 7,329.5 8,264.1 9,500.7 10,916.31 Cocoa and chocolate P 1,522.5 1,404.5 1,535.9 1,760.9 2,439.2 2,484.4 2,750.6 2,659.2 2,661.6 3,298.8 3,476.2 4,295.2 4,680.6 4,096.1 4.147.7- Coffee and tea 3,603.7 3,441.8 2,400.7 2,455.0 2,871.9 3,144.3 3,770.8 4, 194.9 4,791.2 5,580.8 5,160.3 6,265.0 9,715.8 8,725.7 7,634.01 Dairy A 930.3 922.3 995.8 1,008.8 1,110.3 1,292.3 1,388.4 1,405.7 1,500.8 1,595.6 1,353.4 1,347.2 1,502.1 1,604.0 1,648.61 Fish and shellfish A 8,859.8 9,879.8 9,663.3 9,963.3 10,859.9 11,106.3 11,840.2 13, 112.3 13,434.6 13,912.0 12,933.9 14,516.7 16,459.4 16,467.5 17,812.0- I Fruits P 4,793.7 4,647.4 4,677.7 5,080.7 5,569.5 5,976.4 6,909.3 7,737.9 9,257.5 9,919.3 9,668.5 10,685.0 12,006.4 12,569.6 13,620.4! Liquors B 2,513.0 2,888.2 3,026.5 3,274.9 3,632.8 3,979.2 4,436.9 6, 126.8 6,034.0 6,315.1 5,372.7 5,550.1 6,670.1 7,902.7 7.822.1 Live meat animals A 1,191.7 1,421.5 1,773.3 1,727.0 1,280.3 1,139.0 1,676.5 2, 177.2 2,592.4 2,269.6 1,658.3 2,011.0 1,890.8 2, 194.7 2,187.8. IMeats A 3,258.9 3,825.9 4,253.6 4,280.5 4,424.6 5,716.8 5,750.0 5,241.3 5,365.4 5,057.9 4,607.9 5,085.7 5,753.0 6,242.4 6,526.8! Nuts 885.2 895.4 745.5 778.1 806.5 1, 185.0 1,260.0 1,244.7 1,368.0 1,555.5 1,477.1 1,665.2 2,170.4 2,314.2 2,337.71 Other edible products 2, 121.9 2, 100.0 2,261.6 2,478.0 3,619.9 4,748.6 5,456.7 5,887.7 6,057.2 6,669.7 6,090.4 6,763.5 8,096.9 11,010.5 9,672.4 Sugar and candy 1,593.7 1,560.9 1,606.6 1,860.4 2,137.6 2, 114.3 2,500.6 3,055.3 2,606.8 2,990.5 3,090.1 4,060.1 5,161.9 4,802.5 4,290.01 Vegetable oils P 1,467.8 1,448.1 1,237.9 1,355.1 1,587.8 2.346.2 2,497.7 2,935.2 3,677.2 5,942.5 4,196.0 4,701.2 7,082.1 6,475.9 6,886.41 Vegetables 3,627.6 _ _3.767.4 _ 4.152.1 4,386.4 5,078.1 5,724.5 6,035.8 6,611.0. 7.246.3 7.787.3 7,503.3 8,683.4 9,632.0 9.881.5 10,670.0; Source: USDA, www.fas.usda.gov/gats. Table can be found at http://www.ers.usda.gov/data-products/us-food-imports.aspx This is a table of US food import value, by food group in Millions of dollars. Classification A = animal foods, P = plant foods, B = beverages1.) Use countif to determine how many food categories are classified as plant. 2.) Take the value in cell H8 and round it to the nearest... hundredth (.01) hundred (100) 3.) For the category of "Cocoa and Chocolate" from 1999-2013, find the following: Mean Median Max Min Range The Interquartile Range Sample Variance Sample Standard Deviation Are there any outliers? Why or why not?5.) For the year 2013 only, create a table which displays the top 3 values of food imports and the bottom 3 values of food imports. Be sure that the cells have referenced the data on the data sheet Top 3 Bottom 3 6.) For the year 2013 only, create a table showing the total value of imports for each classification of food. Hint: Classifications are A, P, or B. Add a column which shows the proportion of each classification Suppose the US imported $120,000 million of food products in 2014. If the US imported food in 2014 in the same proportions as in 2013, predict the amount of beverage imports for 2014. 7.) Create a column graph and a pie chart from this table based on the total value of imports. Is the column graph representing a bar graph or a histogram
Step by Step Solution
There are 3 Steps involved in it

Get step-by-step solutions from verified subject matter experts