

Question: Please provide excel work fomular and steps. Evaluate the financial performance of each company based on ROE, ROA. Profit Margin, Asset tumover, APT, ART, INVT,
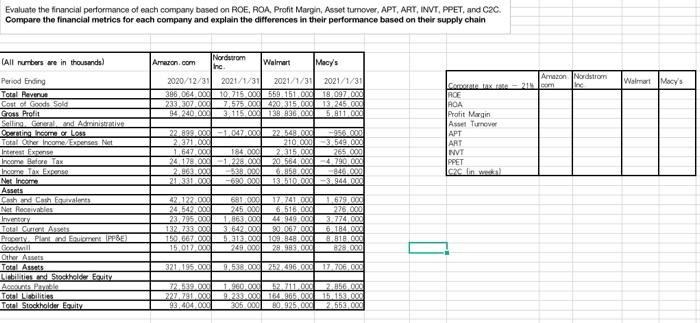
Evaluate the financial performance of each company based on ROE, ROA. Profit Margin, Asset tumover, APT, ART, INVT, PPET, and C2C. Compare the financial metrics for each company and explain the differences in their performance based on their supply chain Walmart Macy's Nordstrom Amazon.com Inc Walmart Macy's 2020/12/31 2021/1/31 2021/1/31 2021/1/31 396,064 000 10,715,000 559.151,000 18.097 233 307.00 72575.004470315.000 13,245.000 94.200.000 3.115002 138 936.00 5,8110 Amazon Nordstrom CARLAK 20 mm LAGE ROA Pratit Margin Asset Turnover | ART NVT PPET (All numbers are in thousands) Period Ending Total Revenue Cost Goods Sold Greas Profil Selling General Admin Outing Income loss Total Other Income/Expenses Net Interest Esime Income Biore Tax Income Tax EO Net Income Assets Birth and Enth valents Net Reaniveles Inventory Total COLASSA Precerty. Plant and Eume PPE Goodwill Other Assets Total Aws Labord Shift AAN Payne Total listilities Total Stockholder Eouity 22.193.00-140270 2.371 001 1.647.001 184.000 24.178.000 1.228.000 2.863.000 -538.000 28351.00 - 22548 -90 210 000 -3.549.00 2315.00 265.000 20 564, 02-4790.00 846.000 13.510 -3.944.000 4122.000 24 542 000 23,795.000 1322330 159.667.00 150000 681.000 245.000 1.863 000 3.64220 17.741.00 6.516.000 44.949.000 30.067 109GARA 289830 1.679.00 276 000 3.774.00 5.14 3.BB.RU 878 000 Z OOG 3211500 252 496.00 17 706,00 1.960.00 227.791.09.283.000 93.404.000 305.000 12 711.00 20. 1548650 1513100 80.925,000 2 553,000 Evaluate the financial performance of each company based on ROE, ROA. Profit Margin, Asset tumover, APT, ART, INVT, PPET, and C2C. Compare the financial metrics for each company and explain the differences in their performance based on their supply chain Walmart Macy's Nordstrom Amazon.com Inc Walmart Macy's 2020/12/31 2021/1/31 2021/1/31 2021/1/31 396,064 000 10,715,000 559.151,000 18.097 233 307.00 72575.004470315.000 13,245.000 94.200.000 3.115002 138 936.00 5,8110 Amazon Nordstrom CARLAK 20 mm LAGE ROA Pratit Margin Asset Turnover | ART NVT PPET (All numbers are in thousands) Period Ending Total Revenue Cost Goods Sold Greas Profil Selling General Admin Outing Income loss Total Other Income/Expenses Net Interest Esime Income Biore Tax Income Tax EO Net Income Assets Birth and Enth valents Net Reaniveles Inventory Total COLASSA Precerty. Plant and Eume PPE Goodwill Other Assets Total Aws Labord Shift AAN Payne Total listilities Total Stockholder Eouity 22.193.00-140270 2.371 001 1.647.001 184.000 24.178.000 1.228.000 2.863.000 -538.000 28351.00 - 22548 -90 210 000 -3.549.00 2315.00 265.000 20 564, 02-4790.00 846.000 13.510 -3.944.000 4122.000 24 542 000 23,795.000 1322330 159.667.00 150000 681.000 245.000 1.863 000 3.64220 17.741.00 6.516.000 44.949.000 30.067 109GARA 289830 1.679.00 276 000 3.774.00 5.14 3.BB.RU 878 000 Z OOG 3211500 252 496.00 17 706,00 1.960.00 227.791.09.283.000 93.404.000 305.000 12 711.00 20. 1548650 1513100 80.925,000 2 553,000
Step by Step Solution
There are 3 Steps involved in it

Get step-by-step solutions from verified subject matter experts