

Question: Please provide feedback for the comment below regarding the data anaysis: In writing: 1. Does there appear to be a linear relationship between number of
Please provide feedback for the comment below regarding the data anaysis:
In writing: 1. Does there appear to be a linear relationship between number of calories and amount of protein? How did you come to that conclusion?
Yes, I do notice a linear relationship between the two variables, I came to that conclusion by looking at how the data is close to the line of correlation and the pattern. Also, I learned that if [r] is close to 1 then there more than likely is a linear relationship.
2. Does the model seem to be effective in predicting the amount of protein based on the number of calories? How would you support this?
Yes, the model shows effectiveness in predicting protein based on calories, I know this because of the consistent pattern and tight clustering of data points around the regression line. The regression equation also supports the model's effectiveness in being able to predict the relationship between calories and protein.
3. What outlier(s), if any, can you identify and where are they located? What is their effect on the regression line? What is the effect on the r value (you may have to run a second plot without the outlier(s) to determine this).
As for outliers in this model, there is only one potential outlier and it is the 2430 calories 186 protein value and after creating a second plot I made the observation that it negatively affects the r2 value, it lowered it from 0.8758 to 0.7257 this surprised me because now this we have less predictability and this made me question if the outlier played a positive role or if I was just wrong in determining It an outlier.
4. In this case, should the outliers remain in the data, or should we remove them? Support your answer with specific details or calculations. I think the outlier definitely has a place in this model and should remain In it for the benefit it gives us like the higher r2 value and better predictability when we look at the correlation between the two values.
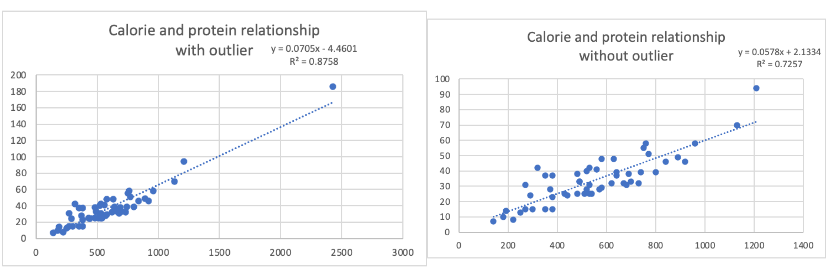
200 180 | 160 | 140 | 120 | 100 | a0 | 60 | 40 | 20 | Calorie and protein relationship 1500 2000 *=0.8758 2500 with outlier =0.0705x - 4.4601 R 3000 100 90 a0 70 G50 50 a0 30 20 10 Calorie and protein relationship without outlier 40 GO0 BOD 1000 y=00578x+ 21334 RZ=0.7257 - ~ 1200 1400
Step by Step Solution
There are 3 Steps involved in it

Get step-by-step solutions from verified subject matter experts