

Question: Please provide for image below an income statement analysis : Please provide the ratio for Sales Growth ,Gross Profit Margin ,Net Profit Margin ,EBITDA ,DSC
Please provide for image below an income statement analysis :
Please provide the ratio for Sales Growth ,Gross Profit Margin ,Net Profit Margin ,EBITDA ,DSC , and OPM.
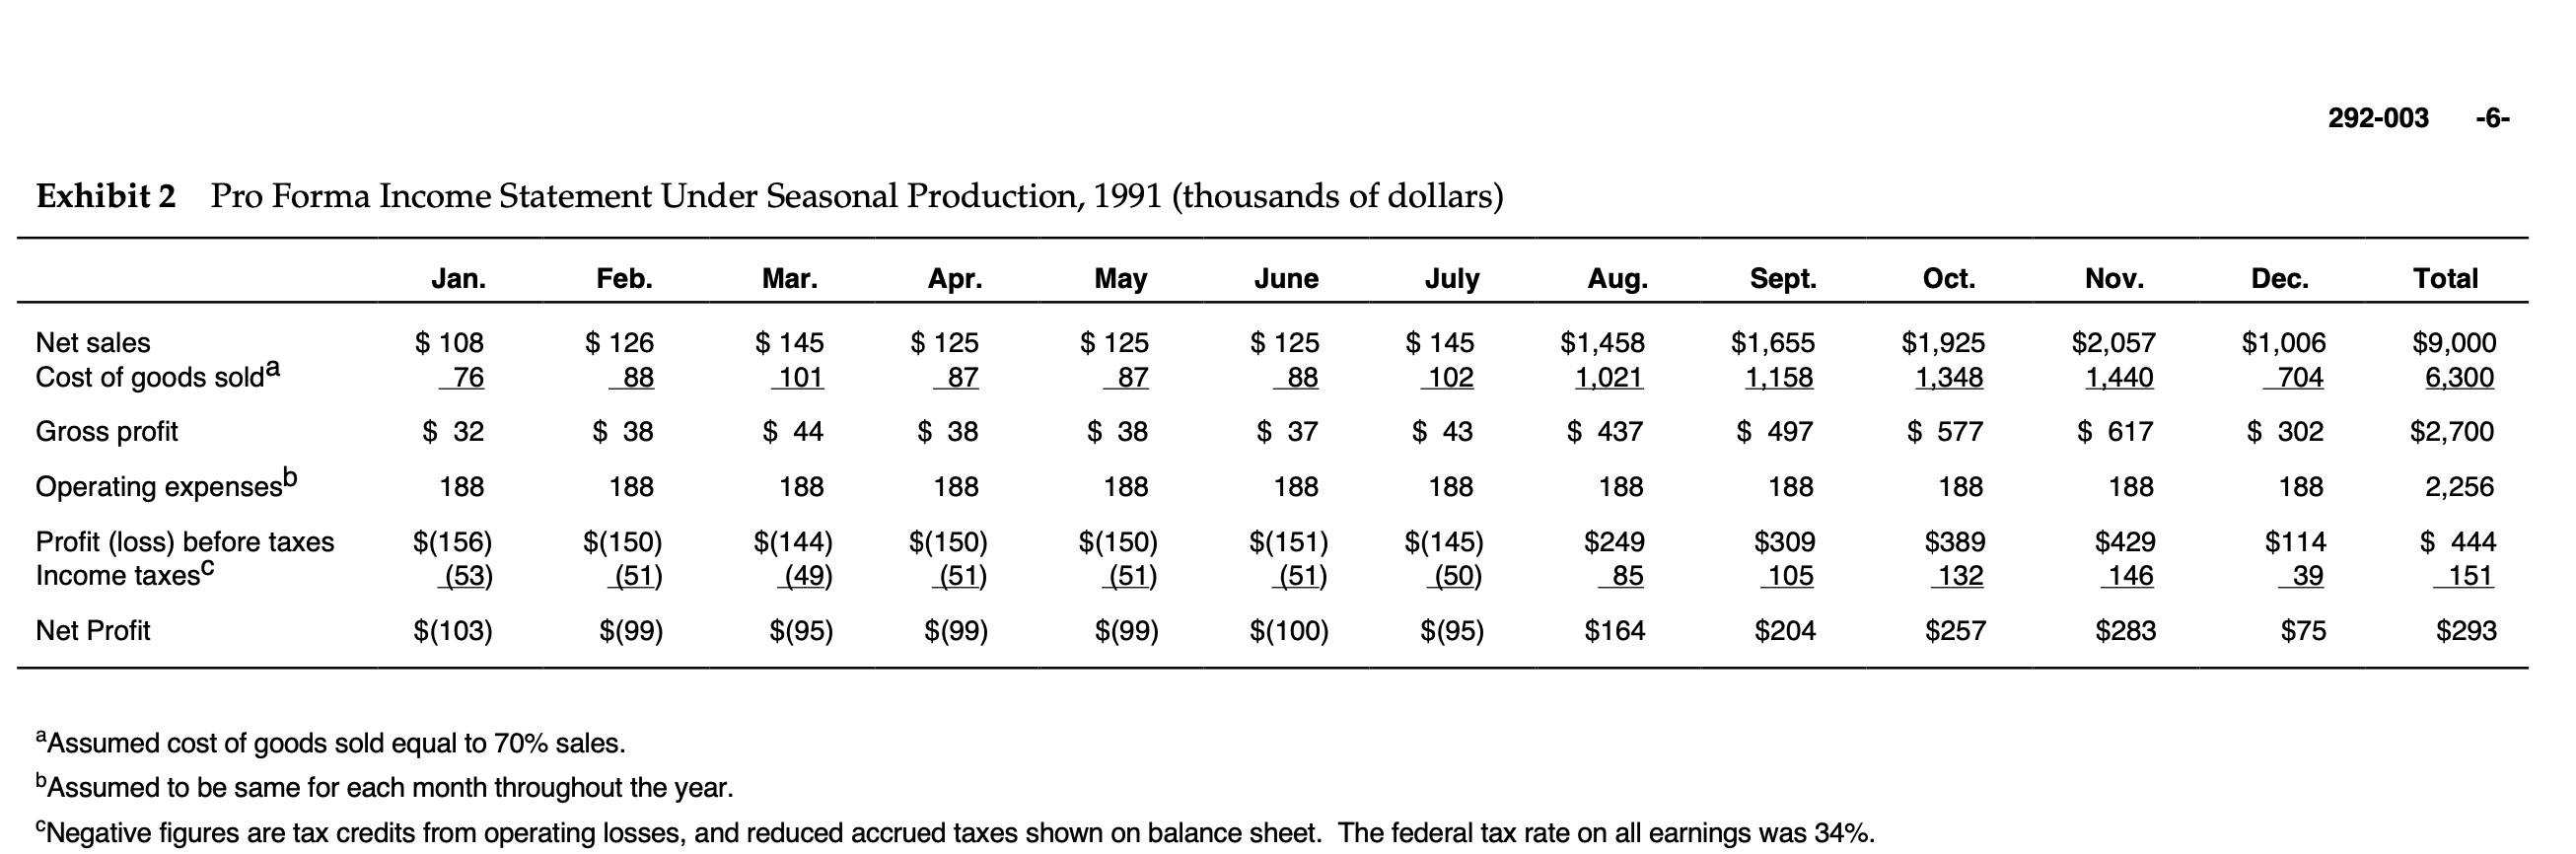
Exhibit 2 Pro Forma Income Statement Under Seasonal Production, 1991 (thousands of dollars) Net sales Cost of goods solda Gross profit Operating expensesb Profit (loss) before taxes Income taxes Net Profit Jan. $108 76 $32 188 $(156) (53) $(103) Feb. $126 88 $38 188 $(150) (51) $(99) Mar. $145 101 $ 44 188 $(144) (49) $(95) Apr. $125 87 $38 188 $(150) (51) $(99) May $125 87 $ 38 188 $(150) (51) $(99) June $ 125 88 $ 37 188 $(151) (51) $(100) July $ 145 102 $ 43 188 $(145) (50) $(95) Aug. $1,458 1,021 $ 437 188 $249 85 $164 Sept. $1,655 1,158 $ 497 188 $309 105 $204 aAssumed cost of goods sold equal to 70% sales. bAssumed to be same for each month throughout the year. "Negative figures are tax credits from operating losses, and reduced accrued taxes shown on balance sheet. The federal tax rate on all earnings was 34%. Oct. $1,925 1,348 $ 577 188 $389 132 $257 Nov. $2,057 1,440 $ 617 188 $429 146 $283 Dec. $1,006 704 292-003 $ 302 188 $114 39 $75 -6- Total $9,000 6,300 $2,700 2,256 $ 444 151 $293
Step by Step Solution
3.47 Rating (157 Votes )
There are 3 Steps involved in it
Income statement analysis Ratios Sales Growth Oct sales Jan sales Jan sales 2057 108 108 18x Gross P... View full answer

Get step-by-step solutions from verified subject matter experts