

Question: please provide formulas and explanations. cheers 2013 16 - 19 2014 34,955 1.90 35,058 1.88 2015 34,979 1.86 2016 34,769 1.89 2017 34,292 1.90 2018
 please provide formulas and explanations. cheers
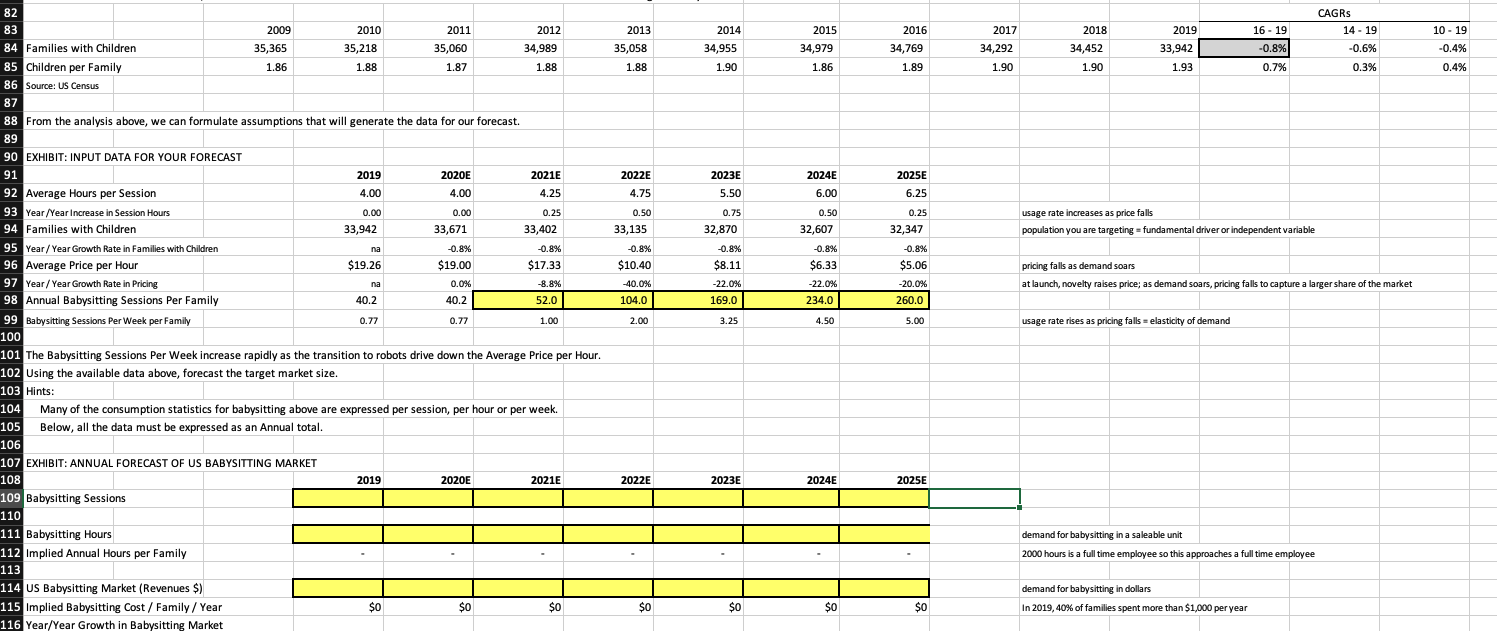
2013 16 - 19 2014 34,955 1.90 35,058 1.88 2015 34,979 1.86 2016 34,769 1.89 2017 34,292 1.90 2018 34,452 1.90 CAGRS 14 - 19 -0.6% 0.3% 2019 33,942 1.93 -0.8% 0.7% 10 - 19 -0.4% 0.4% 2022E 2023E 2024E 6.00 2025E 6.25 4.75 5.50 0.25 0.50 33,135 0.75 32,870 0.50 32,607 usage rate increases as price falls population you are targeting = fundamental driver or independent variable 32,347 na -0.8% $10.40 -0.8% $6.33 -0.8% $8.11 -22.0% 169.0 -0.8% $5.06 -20.0% 260.0 pricing falls as demand soars at launch, novelty raises price; as demand soars, pricing falls to capture a larger share of the market na -40.0% 104.0 -22.0% 234.0 82 83 2009 2010 2011 2012 84 Families with Children 35,365 35,218 35,060 34,989 85 Children per Family 1.86 1.88 1.87 1.88 86 Source: US Census 87 88 From the analysis above, we can formulate assumptions that will generate the data for our forecast. 89 90 EXHIBIT: INPUT DATA FOR YOUR FORECAST 91 2019 2020E 2021E 92 Average Hours per Session 4.00 4.00 4.25 93 Year/Year increase in Session Hours 0.00 0.00 0.25 94 Families with Children 33,942 33,671 33,402 95 Year / Year Growth Rate in Families with Children -0.8% -0.8% 96 Average Price per Hour $19.26 $19.00 $17.33 97 Year / Year Growth Rate in Pricing 0.0% -8.8% 98 Annual Babysitting Sessions Per Family 40.2 40.2 52.0 99 Babysitting Sessions Per Week per Family 0.77 0.77 1.00 100 101 The Babysitting Sessions Per Week increase rapidly as the transition to robots drive down the Average Price per Hour. 102 Using the available data above, forecast the target market size. 103 Hints: 104 Many of the consumption statistics for babysitting above are expressed per session, per hour or per week. 105 Below, all the data must be expressed as an Annual total. . 106 107 EXHIBIT: ANNUAL FORECAST OF US BABYSITTING MARKET 108 2019 2020E 2021E 109 Babysitting Sessions 110 111 Babysitting Hours 112 Implied Annual Hours per Family 113 114 US Babysitting Market (Revenues $) 115 Implied Babysitting Cost / Family / Year $0 $0 $0 $ 116 Year/Year Growth in Babysitting Market 2.00 3.25 4.50 5.00 usage rate rises as pricing falls - elasticity of demand 2022E 2023E 2024E 2025E demand for babysitting in a saleable unit 2000 hours is a full time employee so this approaches a full time employee demand for babysitting in dollars In 2019, 40% of families spent more than $1,000 per year $0 $0 $0 $0 2013 16 - 19 2014 34,955 1.90 35,058 1.88 2015 34,979 1.86 2016 34,769 1.89 2017 34,292 1.90 2018 34,452 1.90 CAGRS 14 - 19 -0.6% 0.3% 2019 33,942 1.93 -0.8% 0.7% 10 - 19 -0.4% 0.4% 2022E 2023E 2024E 6.00 2025E 6.25 4.75 5.50 0.25 0.50 33,135 0.75 32,870 0.50 32,607 usage rate increases as price falls population you are targeting = fundamental driver or independent variable 32,347 na -0.8% $10.40 -0.8% $6.33 -0.8% $8.11 -22.0% 169.0 -0.8% $5.06 -20.0% 260.0 pricing falls as demand soars at launch, novelty raises price; as demand soars, pricing falls to capture a larger share of the market na -40.0% 104.0 -22.0% 234.0 82 83 2009 2010 2011 2012 84 Families with Children 35,365 35,218 35,060 34,989 85 Children per Family 1.86 1.88 1.87 1.88 86 Source: US Census 87 88 From the analysis above, we can formulate assumptions that will generate the data for our forecast. 89 90 EXHIBIT: INPUT DATA FOR YOUR FORECAST 91 2019 2020E 2021E 92 Average Hours per Session 4.00 4.00 4.25 93 Year/Year increase in Session Hours 0.00 0.00 0.25 94 Families with Children 33,942 33,671 33,402 95 Year / Year Growth Rate in Families with Children -0.8% -0.8% 96 Average Price per Hour $19.26 $19.00 $17.33 97 Year / Year Growth Rate in Pricing 0.0% -8.8% 98 Annual Babysitting Sessions Per Family 40.2 40.2 52.0 99 Babysitting Sessions Per Week per Family 0.77 0.77 1.00 100 101 The Babysitting Sessions Per Week increase rapidly as the transition to robots drive down the Average Price per Hour. 102 Using the available data above, forecast the target market size. 103 Hints: 104 Many of the consumption statistics for babysitting above are expressed per session, per hour or per week. 105 Below, all the data must be expressed as an Annual total. . 106 107 EXHIBIT: ANNUAL FORECAST OF US BABYSITTING MARKET 108 2019 2020E 2021E 109 Babysitting Sessions 110 111 Babysitting Hours 112 Implied Annual Hours per Family 113 114 US Babysitting Market (Revenues $) 115 Implied Babysitting Cost / Family / Year $0 $0 $0 $ 116 Year/Year Growth in Babysitting Market 2.00 3.25 4.50 5.00 usage rate rises as pricing falls - elasticity of demand 2022E 2023E 2024E 2025E demand for babysitting in a saleable unit 2000 hours is a full time employee so this approaches a full time employee demand for babysitting in dollars In 2019, 40% of families spent more than $1,000 per year $0 $0 $0 $0
Step by Step Solution
There are 3 Steps involved in it

Get step-by-step solutions from verified subject matter experts