

Question: PLEASE PROVIDE FURTHER ANALYSIS. I DO NOT NEED HELP WITH ANY CALCULATIONS, I JUST NEED HELP WITH COmING UP WITH A PARAGRAPH OR TWO OF
PLEASE PROVIDE FURTHER ANALYSIS. I DO NOT NEED HELP WITH ANY CALCULATIONS, I JUST NEED HELP WITH COmING UP WITH A PARAGRAPH OR TWO OF ANALYSIS
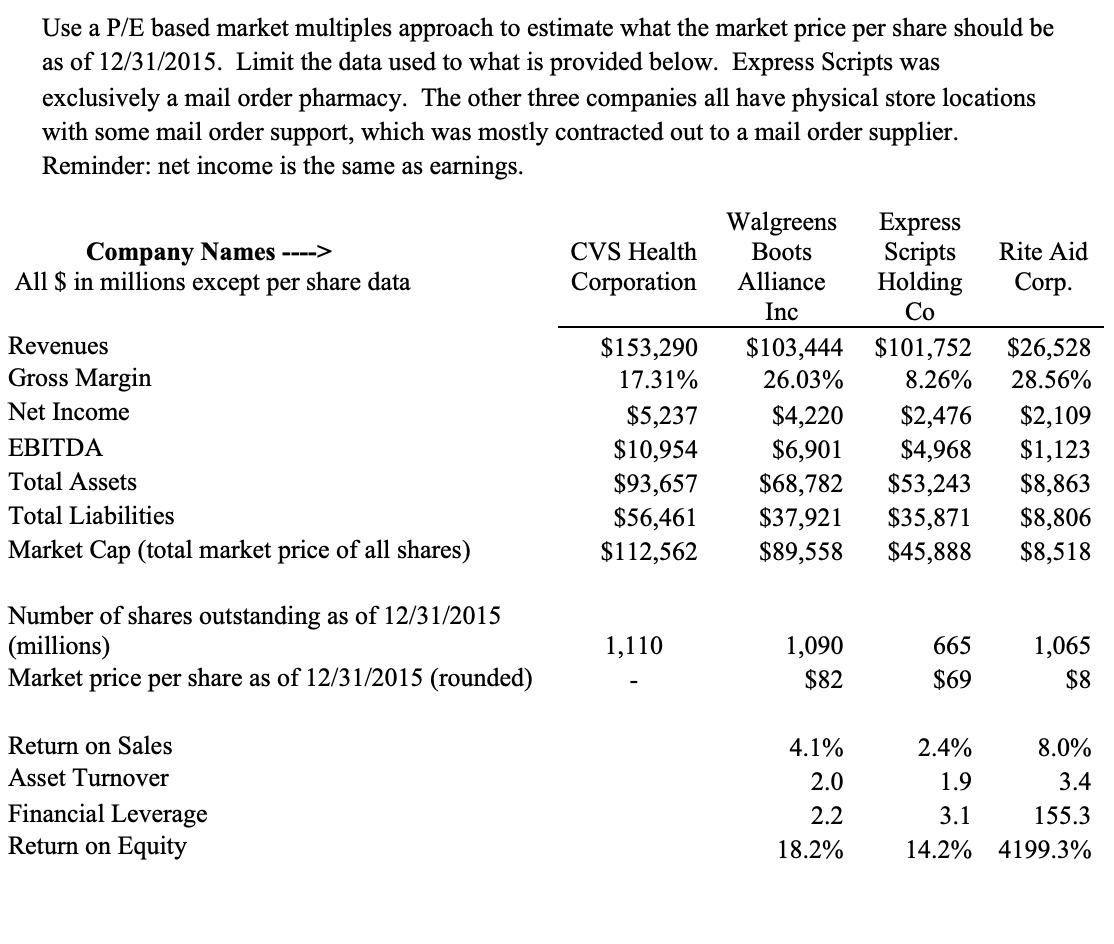
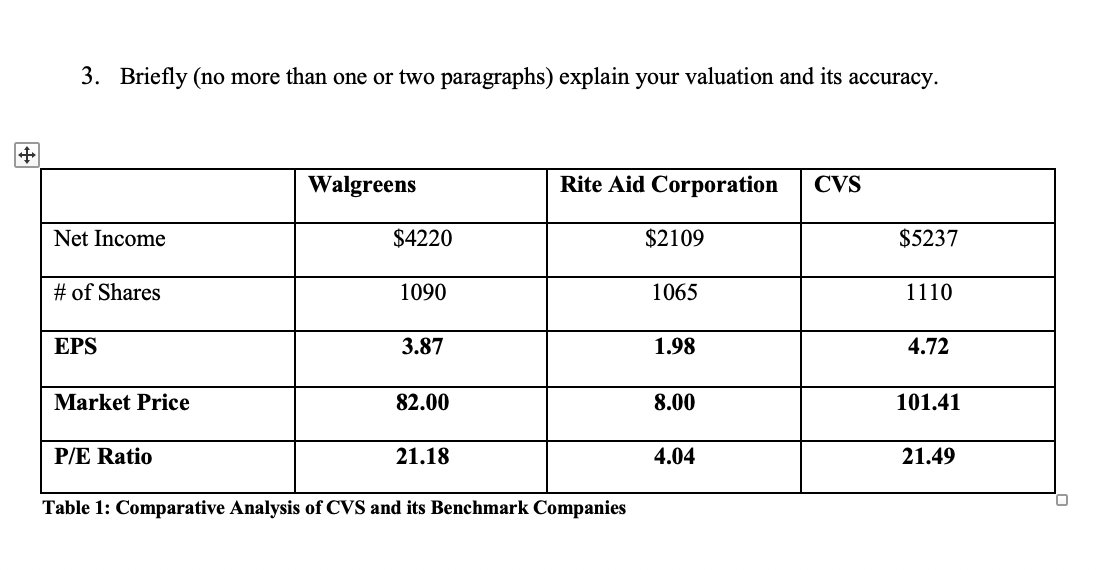
Use a P/E based market multiples approach to estimate what the market price per share should be as of 12/31/2015. Limit the data used to what is provided below. Express Scripts was exclusively a mail order pharmacy. The other three companies all have physical store locations with some mail order support, which was mostly contracted out to a mail order supplier. Reminder: net income is the same as earnings. Company Names ----> All $ in millions except per share data CVS Health Corporation Rite Aid Corp. Inc Revenues Gross Margin Net Income EBITDA Total Assets Total Liabilities Market Cap (total market price of all shares) $153,290 17.31% $5,237 $10,954 $93,657 $56,461 $112,562 Walgreens Express Boots Scripts Alliance Holding Co $103,444 $101,752 26.03% 8.26% $4,220 $2,476 $6,901 $4,968 $68,782 $53,243 $37,921 $35,871 $89,558 $45,888 $26,528 28.56% $2,109 $1,123 $8,863 $8,806 $8,518 Number of shares outstanding as of 12/31/2015 (millions) Market price per share as of 12/31/2015 (rounded) 1,110 1,090 $82 665 $69 1,065 $8 2.4% 1.9 Return on Sales Asset Turnover Financial Leverage Return on Equity 4.1% 2.0 2.2 18.2% 8.0% 3.4 155.3 4199.3% 3.1 14.2% 3. Briefly (no more than one or two paragraphs) explain your valuation and its accuracy. Walgreens Rite Aid Corporation CVS Net Income $4220 $2109 $5237 # of Shares 1090 1065 1110 EPS 3.87 1.98 4.72 Market Price 82.00 8.00 101.41 P/E Ratio 21.18 4.04 21.49 Table 1: Comparative Analysis of CVS and its Benchmark Companies Use a P/E based market multiples approach to estimate what the market price per share should be as of 12/31/2015. Limit the data used to what is provided below. Express Scripts was exclusively a mail order pharmacy. The other three companies all have physical store locations with some mail order support, which was mostly contracted out to a mail order supplier. Reminder: net income is the same as earnings. Company Names ----> All $ in millions except per share data CVS Health Corporation Rite Aid Corp. Inc Revenues Gross Margin Net Income EBITDA Total Assets Total Liabilities Market Cap (total market price of all shares) $153,290 17.31% $5,237 $10,954 $93,657 $56,461 $112,562 Walgreens Express Boots Scripts Alliance Holding Co $103,444 $101,752 26.03% 8.26% $4,220 $2,476 $6,901 $4,968 $68,782 $53,243 $37,921 $35,871 $89,558 $45,888 $26,528 28.56% $2,109 $1,123 $8,863 $8,806 $8,518 Number of shares outstanding as of 12/31/2015 (millions) Market price per share as of 12/31/2015 (rounded) 1,110 1,090 $82 665 $69 1,065 $8 2.4% 1.9 Return on Sales Asset Turnover Financial Leverage Return on Equity 4.1% 2.0 2.2 18.2% 8.0% 3.4 155.3 4199.3% 3.1 14.2% 3. Briefly (no more than one or two paragraphs) explain your valuation and its accuracy. Walgreens Rite Aid Corporation CVS Net Income $4220 $2109 $5237 # of Shares 1090 1065 1110 EPS 3.87 1.98 4.72 Market Price 82.00 8.00 101.41 P/E Ratio 21.18 4.04 21.49 Table 1: Comparative Analysis of CVS and its Benchmark Companies
Step by Step Solution
There are 3 Steps involved in it

Get step-by-step solutions from verified subject matter experts