

Question: Please provide help as how to complete the Capital Structure tab and Valuation tab of the excel sheet the yellow portions Capital Structure : In
Please provide help as how to complete the "Capital Structure" tab and "Valuation" tab of the excel sheet the yellow portions
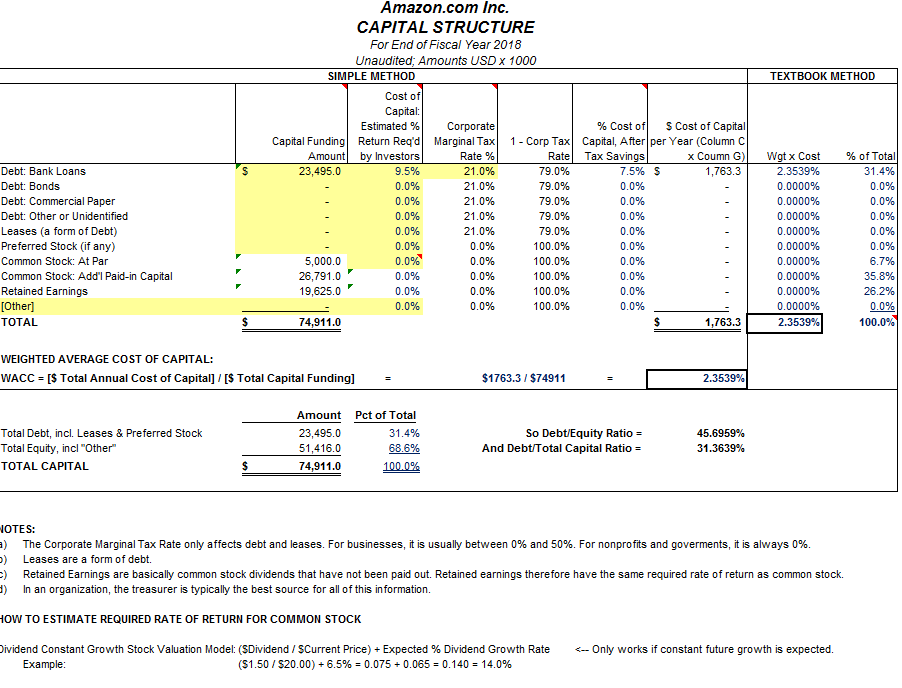
Capital Structure: In the third section of your report, discuss the capital structure of the corporation.
A. Outline the most recent year's debt, equity, and total capital using the provided Excel template to show the overall capital structure of the corporation. Please note: to complete this, you will use the same template you used in support of Milestone One, but this time you will be completing the "Capital Structure" tab.
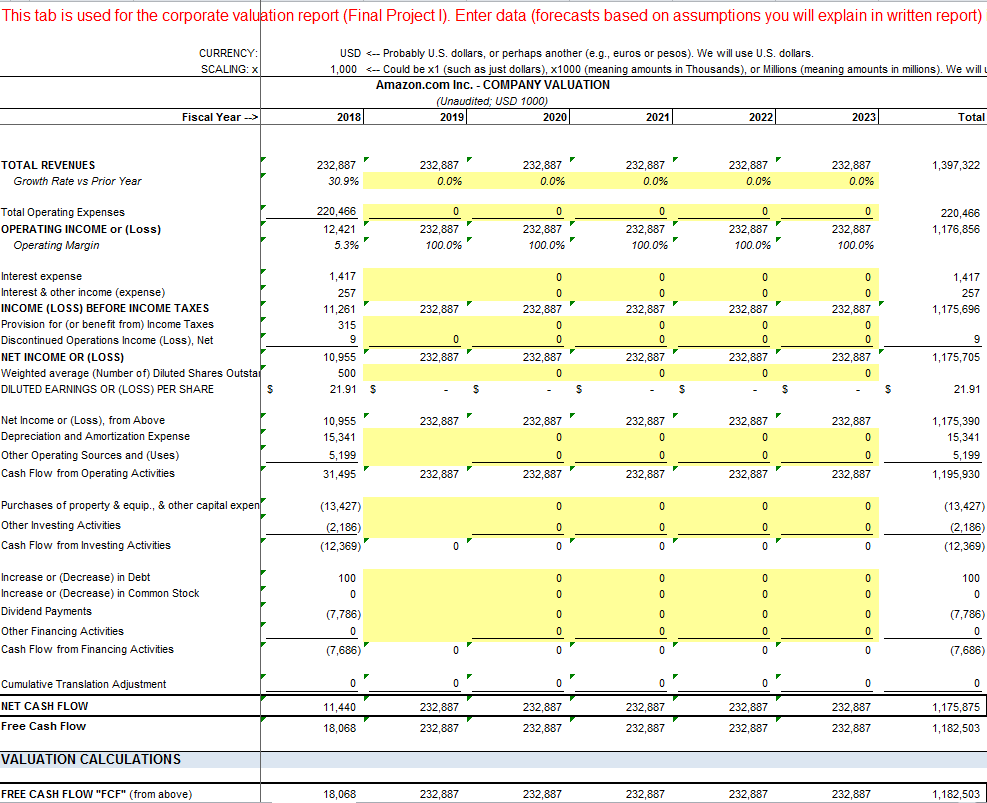
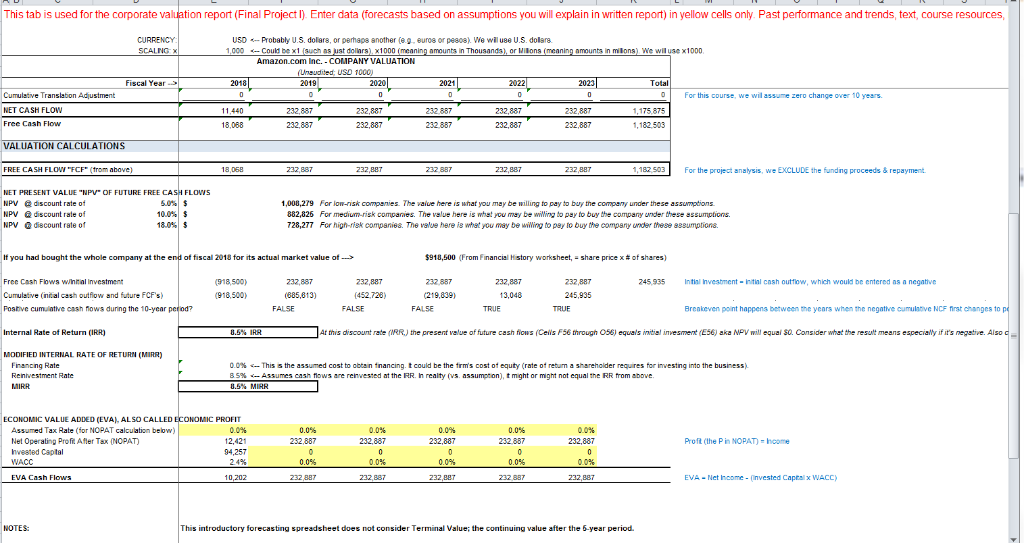
IV. Valuation: The final section of your report will focus on calculating current value, outlining assumptions, and estimating the future value of the corporation through forecasting the cash flows. Specifically, respond to the following:
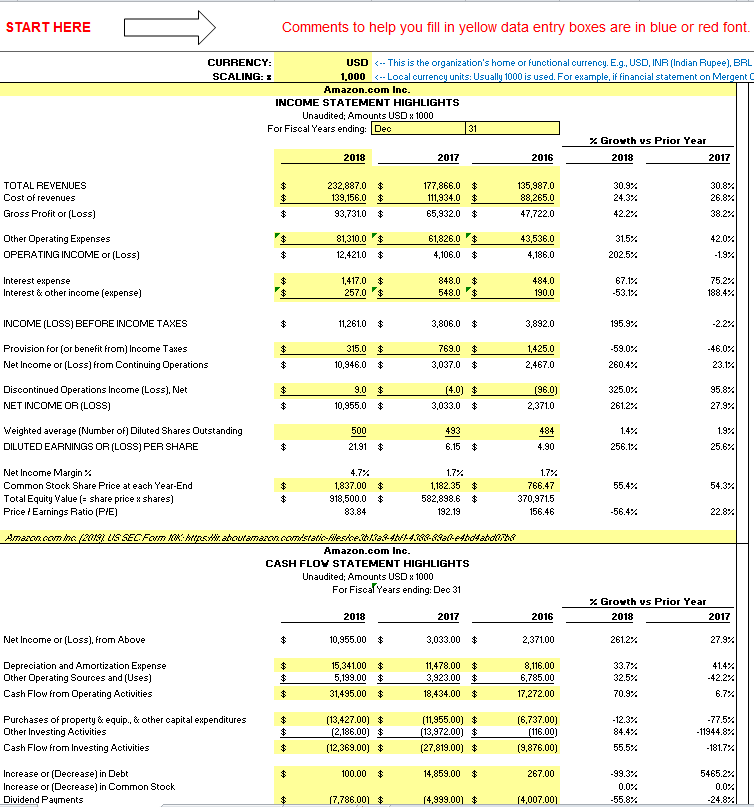
A. Calculate the current market value of equity for your corporation, using the three-year history and provided Excel template, and explain what it means for the corporation. You will submit this template along with your report, and may embed pieces of the Excel template into your report to help support your work in this section. Please note: this is the same template you used in support of Milestone One, but this time you will be completing the "Valuation" tab.
Financial History below
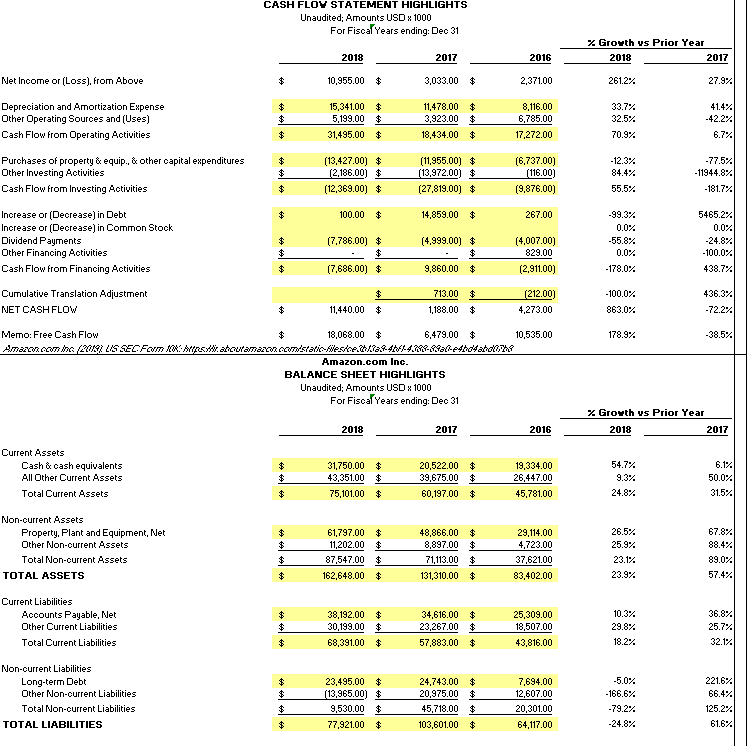
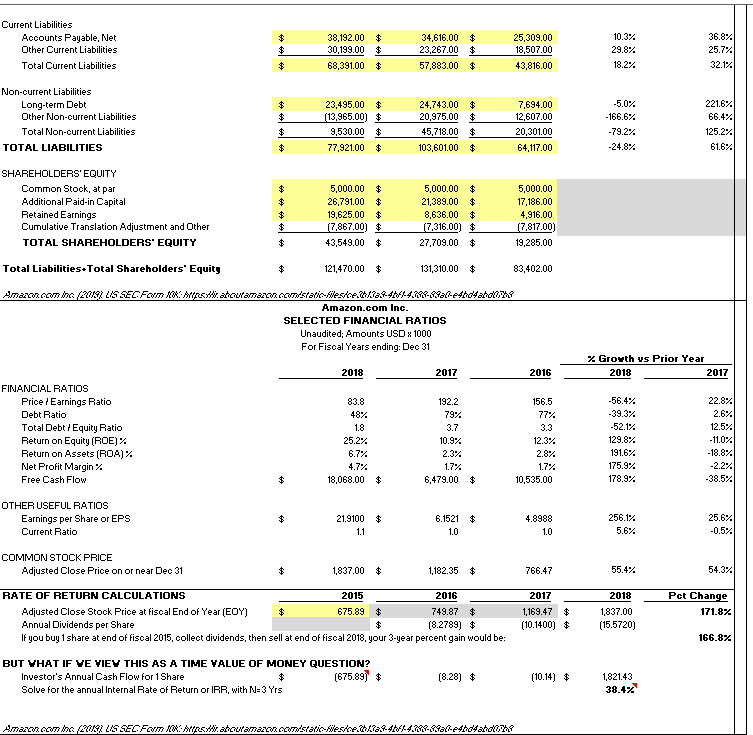
Amazon.com Inc. CAPITAL STRUCTURE For End of Fiscal Year 2018 Unaudited; Amounts USD x 1000 SIMPLE METHOD TEXTBOOK METHOD Capital Estimated%) Return Req'dMargiax1- Corp Tax Capital, After per Year (Column % Cost of | Corporate S Cost of Capital Capital Funding Amount Investors Rate % Rate Tax Savings x Coumn G) | Watx Cost % of Total Debt: Bank Loans 23,495.0 9.5% 79.0% 7.5% s 1,763.3 2.3539% 79.0% 0.0% Debt: Bonds 0.0% 21.0% 0.0000% 0.0% 79.0% 0.0% 0.0000% Debt: Commercial Paper 0.0% 21.0% 0.0% 79.0% 0.0000% Debt: Other or Unidentified 0.0% 21.0% 0.0% 21.0% 0.0% 79.0% Leases (a form of Debt) 0.0% 0.0% 0.0000% 0.0% 0.0% Preferred Stock (if any) 0.0% 100.0% 0.0000% 0.0% 5,000.0 0.0% 0.0000% Common Stock: At Par 100.0% 67% 26,791.0 0.0000% Common Stock: Addl Paid-in Capital Retained Earnings 0.0% 100.0% 0.0% 35.8% 19,625.0 0.0% 100.0% 0.0% 0.0000% 26.2% 0.0% 100.0% 0.0000% 0.0% TOTAL 74,911.0 1,763.3 100.0% 2.3539% WEIGHTED AVERAGE COST OF CAPITAL: WACC [S Total Annual Cost of Capital] [S Total Capital Funding]- $1763.3/$74911 2.3539% Amount Pct of Total 23,495.0 Total Debt, incl. Leases & Preferred Stock So DebtEquity Ratio And DebtTotal Captal atio- 45.6959% 51,416.0 Total Equity, incl "Other 68.6% 31.3639% 74,911.0 TOTAL CAPITAL OTES: ) The Corporate Marginal Tax Rate only affects debt and leases. For businesses, it is usually between 0% and 50%. For nonprofits and goverments, it is always 0%. ) Leases are a form of debt. Retained Earnings are basically common stock dividends that have not been paid out. Retained earnings therefore have the same required rate of return as common stock. ) In an organization, the treasurer is typically the best source for all of this information. OW TO ESTIMATE REQUIRED RATE OF RETURN FOR COMMON STOCK ividend Constant Growth Stock Valuation Model: (SDividend / SCurrent Price) + Expected % Dividend Growth Rate Example 2018 2019 2020 2022 2023 TOTAL REVENUES 232,887 232,887 232,887 232,887 232,887 232,887 Growth Rate vs Prior Year 30.9% 220,466 Total Operating Expenses 220,466 232,887 232,887 232,887 OPERATING INCOME or (Loss) 232,887 232,887 100.0% 100.0% 100.0% 100.0% 100.0% in Interest expense Interest & other income (expense) 257 257 INCOME (LOSS) BEFORE INCOME TAXES 1,175,696 232,887 232,887 232,887 232,887 232,887 Provision for (or benefit from) Income Taxes Discontinued Operations Income (Loss), Net 232,887 232,887 232,887 232,887 NET INCOME OR (LOSS) 232,887 1,175,705 Weighted average (Number of) Diluted Shares Outsta 500 DILUTED EARNINGS OR (LOSS) PER SHARE Net Income or (Loss), from Above 232,887 232,887 232,887 232,887 232,887 1,175,390 Depreciation and Amortization Expense Other Operating Sources and (Uses) 232,887 232,887 232,887 232,887 1,195,930 Cash Flow from Operating Activities 232,887 Purchases of property & equip., & other capital e Other Investing Activities 186) Cash Flow from Investing Activities (12,369) (12,369) Increase or (Decrease) in Debt Increase or (Decrease) in Common Stock nts Other Financing Activities Cash Flow from Financing Activities Cumulative Translation A djustment NET CASH FLOW 232,887 232,887 232,887 232,887 232,887 1,175,875 Free Cash Flow 232,887 232,887 232,887 232,887 232,887 1,182,503 VALUATION CALCULATIONS FREE CASH FLOW "FCF" (from above) 232,887 232,887 232,887 232,887 232,887 1,182,503 START HERE Comments to help you fill in yellow data entry boxes are in blue or red font. CURRENCY USD -This is the organization's home or functional currency. E.g., USD, INRIIndian Rupee), BRL SCALING: i 1,000 -Local currency units: Usually 1000 is used. For example, if financial statement on Mergent Amazon.com Inc INCOME STATEMENT HIGHLIGHTS Unaudited; Amounts USD1000 For Fiscal Years ending: Dec % Growth vs Prior Year 2018 2017 2016 2018 2017 177,866.0 $ 30.9% TOTALREVENUES 232,887.0 $ 135,987.0 Cost of revenues 88.265.0 24.3% Gross Profit or (Loss) 93,731.0 $ 65,932.0 $ 47,722.0 42.2% 38.2% Other Operating Expenses 43,536.0 42.0% 4.106.0 $ OPERATING INCOME or Loss) 12,4210 $ 848.0 75.2% 484.0 Interest &other income (expense) 53.1% -2.2% INCOME (LOSS) BEFORE INCOME TAXES 11,261.0 $ 195.9% Provision for or benefit from) Income Taxes Net Income or (Loss) from Continuing Operations 10,946.0 $ 3,037.0 2,467.0 325.0% Discontinued Operations Income (Loss), Net 261.2% NET INCOME OR (LOSS) 10,955.0 $ 3,033.0 2.371.0 Weighted average [Nmber of) Diluted Shares Outstanding 484 DILUTED EARNINGS OR (LOSS) PER SHARE 256.1% Net Income Margin % 1,837.00 $ Common Stock Share Price at each Year-End 1,182.35$ 370,971.5 Total Equity Value (- share price x shares) 918,500.0 $ 582,898.6 $ Price Earnings Ratio (PIE) 192.19 ahowamazcor cconstatic esehtaftff fe4hosaholohi CASH FLOV STATEMENT HIGHLIGHTS Unaudited; Amounts USD1000 For Fiscal Years ending: Dec 31 % Growth vs Prior Year 2018 2017 2016 2018 2017 2,37100 Net Income or (Loss), from Above 10,955.00 $ 3,033.00 $ 261.2% 15,341.00 $ Depreciation and Amortization Expense Other Operating Sources and (Uses) 11,478.00 $ 5,199.00$3,923.00$6,785.00 8,116.00 -42.2% Cash Flow from Operating Activities 31,495.00 $ 18,434.00 $ 17,272.00 Purchases of property & equip., & other capital expenditures Other InvestingActivities (13,427.00) $ (11,955.00) $ 13,972.00 11944.8% (9,876.00) Cash Flow from Investing Activities (12,369.00) (27819.00 Increase oDecrease) in Debt Increase oDecrease) in Common Stock 14,859.00 $ 5465.2% Dividend Pauments 4,999.001 4,007.001 CASH FLOV STATEMENT HIGHLIGHTS Unaudited; Amounts USD1000 For Fiscal Years ending: Dec 31 % Growth vs Prior Year 2018 2017 2016 2018 2017 10,955.00$ 2612% Net Income or (Loss), from Above 3,033.00 $ 2,371.00 33.7% Depreciation and Amortization Expense Other Operating Sources and (Uses) 5,34100 $ 11,478.00 $ 5,199.00$3,923.00$6,785.00 8,116.00 -42.2% 70,9% 17,272.00 Cash Flow from Operating Activities 31,495.00 $ 18,434.00 $ (13,427.00) 12.3% Purchases of property & equip., & other capital expenditures Other Investing Activities (11,955.00) $ (13.972.00) 11944.8% (9.876.00) Cash Flow from Investing Activities (12,369.00) $ (27,819.00) $ 181.7% 14,859.00$ 99.3% Increase oDecrease) in Debt Increase oDecrease) in Common Stock Dividend Payments Other Financing 54 65.2% 0.0% 55.8% (7,786.00) $ (4,999.00) $ (4,007.00) 0.0% 100.0% Activities 178.0% Cash Flow from Financing Activities 9,860.00 $ (2,911.00) 438.7% (7686.00 436.3% Cumulative Translation Adjustment 100.0% 11,440.00 863,0% NET CASHFLOW 4,273.00 -72.2% 18,068.00$ 10,535.00 178.9% MMemo: Free Cash Flow 6,479.00 . about amazoncom/static-files/ce3bl3ag-4bf1-4388-89a0-e4bd4 abd07b8 BALANCE SHEET HIGHLIGHTS Unaudited; Amounts USD1000 For Fiscal Years ending: Dec 31 % Growth vs Prior Year 2018 2017 2016 2018 2017 Current Assets 54.7% Cash & cash equivalents 20,522.00 $ 31,750.00 $ 43,351.00 $33,675.00 19,334.00 26.447 9.3% All Other Current Assets 4.8% Total Current Assets 45,781.00 Non-current Assets Property. Plant and Equipment, Net 61,797.00 $ 11.202008.83r-00 87.547.00iSO 48,866.00 $ 29,114.00 4.723.00 Other Non-current Assets 37,621.00 Total Non-current Assets 71,113.00 TOTAL ASSETS 162,648.00 $ 131,310.00 $ 83,402.00 Current Liabilities 10.3% Accounts Payable, Net Other Cret Liabilities 23,26700 3.000 30,199.00 18,507.00 25.7% 18.2% Total Current Liabilities 68,391.00 $ 57,883.00 $ 43,816.00 Non-current Liabilities 5,0% 24,743.00 $ 7,694.00 221.6% 23,495.00 166.6% Other Non-current Liabilities $13,965.00) $20,975.00 $ 12,607.00 $9,530.00 45,71800$20,301.00 Total Non-current Liabilities 79.2% -24.8% TOTAL LIABILITIES 77,921.00 $ 103,601.00 $ 64,117.00 Current Liabilities 10.3% 38,192.00 $ Accounts Payable, Net Other Cret Liabilities 25,309.00 23,267.00 $18.507.00 30,199.00 25.7% 57,883.00 18.2% Total Current Liabilities 68,391.00 $ 43,816.00 Non-current Liabilities 5,0% 24,743.00 $ $13,965.00) $20,975.00 $ 9,530.00,00 7,694.00 221.6% Long-term Debt Other Non-current Liabilities 23,495.00 $ 166.6% 12,607.00 Total Non-current Liabilities 79.2% -24.8% TOTAL LIABILITIES 77,921.00 $ 103,601.00 $ 64,117.00 SHAREHOLDERS EQUITY 5,000.00 $ Common Stock, at par Additional Paid-in Capital Retained Earnings Cumulative Translation Adjustment and Other 5,000.00 $ 5,000.00 26,791.00 $ 21,389.00 $ 17,186.00 19,625.00 $ 8,636.00 $ 867.00 TOTAL SHAREHOLDERS EQUITY 43,549.00 $ 27,709.00 $ 19,285.00 Totl Liabilities Total Shareholders Equit 121,470.00 $ 131,310.00 $ M. about amazon comist atic-files/ceIt.;3a3-4b 4388-83a0-e4bd4 abd07b8 SELECTED FINANCIAL RATIOS Unaudited; Amounts USD1000 For Fiscal Years ending: Dec 31 % Growth vs Prior Year 2018 2017 2016 2018 2017 FINANCIAL RATIOS 22.8% Price Earnings Ratio 192.2 48% Debt Ratio 79% 77% 52.1% Total DebtEquity Ratio Return on Equity [ROE) % Return on Assets(ROA) % Net Profit Margin % 10.9% 12.3% 129.8% 25.2% 67% 2.8% 175.9% 4.7% 1.7% 1.7% -2.2% 178.9% 10,535.00 Free Cash Flow 18,068.00 $ 6,479.00 OTHERUSEFUL RATIOS 4.8988 2561% 25.6% Earnings per Share or EPS 21.9100 $ Current Ratio 1.1 COMMONSTOCK PRICE Adjusted Close Price on or near Dec 31 1,837.00 $ 1,182.35 $ 766.47 RATE OF RETURN CALCULATIONS 2015 2016 2017 2018 Pct Change 675.89$ 749.87 171.8% Adjusted Close Stock Price at fiscal End of Year (EOY) Annual Dividends per Share If you buy 1share at end of fiscal 2015, collect dividends, then sell at end of fiscal 2018, your 3-year percent gain would be 1,169.47$ 1837.00 (15.5720) (8.2789) $ 166.8% BUT YHAT IF YE YIEY THIS AS A TIME YALUE OF MONEY QUESTION? (675.89) $ 8.28) Inuestor's Annual Cash Flow for 1 Share 1,821.43 Solue for the annual Internal Rate of Return or IRR, with N-3 Yrs Amazon.com Inc. CAPITAL STRUCTURE For End of Fiscal Year 2018 Unaudited; Amounts USD x 1000 SIMPLE METHOD TEXTBOOK METHOD Capital Estimated%) Return Req'dMargiax1- Corp Tax Capital, After per Year (Column % Cost of | Corporate S Cost of Capital Capital Funding Amount Investors Rate % Rate Tax Savings x Coumn G) | Watx Cost % of Total Debt: Bank Loans 23,495.0 9.5% 79.0% 7.5% s 1,763.3 2.3539% 79.0% 0.0% Debt: Bonds 0.0% 21.0% 0.0000% 0.0% 79.0% 0.0% 0.0000% Debt: Commercial Paper 0.0% 21.0% 0.0% 79.0% 0.0000% Debt: Other or Unidentified 0.0% 21.0% 0.0% 21.0% 0.0% 79.0% Leases (a form of Debt) 0.0% 0.0% 0.0000% 0.0% 0.0% Preferred Stock (if any) 0.0% 100.0% 0.0000% 0.0% 5,000.0 0.0% 0.0000% Common Stock: At Par 100.0% 67% 26,791.0 0.0000% Common Stock: Addl Paid-in Capital Retained Earnings 0.0% 100.0% 0.0% 35.8% 19,625.0 0.0% 100.0% 0.0% 0.0000% 26.2% 0.0% 100.0% 0.0000% 0.0% TOTAL 74,911.0 1,763.3 100.0% 2.3539% WEIGHTED AVERAGE COST OF CAPITAL: WACC [S Total Annual Cost of Capital] [S Total Capital Funding]- $1763.3/$74911 2.3539% Amount Pct of Total 23,495.0 Total Debt, incl. Leases & Preferred Stock So DebtEquity Ratio And DebtTotal Captal atio- 45.6959% 51,416.0 Total Equity, incl "Other 68.6% 31.3639% 74,911.0 TOTAL CAPITAL OTES: ) The Corporate Marginal Tax Rate only affects debt and leases. For businesses, it is usually between 0% and 50%. For nonprofits and goverments, it is always 0%. ) Leases are a form of debt. Retained Earnings are basically common stock dividends that have not been paid out. Retained earnings therefore have the same required rate of return as common stock. ) In an organization, the treasurer is typically the best source for all of this information. OW TO ESTIMATE REQUIRED RATE OF RETURN FOR COMMON STOCK ividend Constant Growth Stock Valuation Model: (SDividend / SCurrent Price) + Expected % Dividend Growth Rate Example 2018 2019 2020 2022 2023 TOTAL REVENUES 232,887 232,887 232,887 232,887 232,887 232,887 Growth Rate vs Prior Year 30.9% 220,466 Total Operating Expenses 220,466 232,887 232,887 232,887 OPERATING INCOME or (Loss) 232,887 232,887 100.0% 100.0% 100.0% 100.0% 100.0% in Interest expense Interest & other income (expense) 257 257 INCOME (LOSS) BEFORE INCOME TAXES 1,175,696 232,887 232,887 232,887 232,887 232,887 Provision for (or benefit from) Income Taxes Discontinued Operations Income (Loss), Net 232,887 232,887 232,887 232,887 NET INCOME OR (LOSS) 232,887 1,175,705 Weighted average (Number of) Diluted Shares Outsta 500 DILUTED EARNINGS OR (LOSS) PER SHARE Net Income or (Loss), from Above 232,887 232,887 232,887 232,887 232,887 1,175,390 Depreciation and Amortization Expense Other Operating Sources and (Uses) 232,887 232,887 232,887 232,887 1,195,930 Cash Flow from Operating Activities 232,887 Purchases of property & equip., & other capital e Other Investing Activities 186) Cash Flow from Investing Activities (12,369) (12,369) Increase or (Decrease) in Debt Increase or (Decrease) in Common Stock nts Other Financing Activities Cash Flow from Financing Activities Cumulative Translation A djustment NET CASH FLOW 232,887 232,887 232,887 232,887 232,887 1,175,875 Free Cash Flow 232,887 232,887 232,887 232,887 232,887 1,182,503 VALUATION CALCULATIONS FREE CASH FLOW "FCF" (from above) 232,887 232,887 232,887 232,887 232,887 1,182,503 START HERE Comments to help you fill in yellow data entry boxes are in blue or red font. CURRENCY USD -This is the organization's home or functional currency. E.g., USD, INRIIndian Rupee), BRL SCALING: i 1,000 -Local currency units: Usually 1000 is used. For example, if financial statement on Mergent Amazon.com Inc INCOME STATEMENT HIGHLIGHTS Unaudited; Amounts USD1000 For Fiscal Years ending: Dec % Growth vs Prior Year 2018 2017 2016 2018 2017 177,866.0 $ 30.9% TOTALREVENUES 232,887.0 $ 135,987.0 Cost of revenues 88.265.0 24.3% Gross Profit or (Loss) 93,731.0 $ 65,932.0 $ 47,722.0 42.2% 38.2% Other Operating Expenses 43,536.0 42.0% 4.106.0 $ OPERATING INCOME or Loss) 12,4210 $ 848.0 75.2% 484.0 Interest &other income (expense) 53.1% -2.2% INCOME (LOSS) BEFORE INCOME TAXES 11,261.0 $ 195.9% Provision for or benefit from) Income Taxes Net Income or (Loss) from Continuing Operations 10,946.0 $ 3,037.0 2,467.0 325.0% Discontinued Operations Income (Loss), Net 261.2% NET INCOME OR (LOSS) 10,955.0 $ 3,033.0 2.371.0 Weighted average [Nmber of) Diluted Shares Outstanding 484 DILUTED EARNINGS OR (LOSS) PER SHARE 256.1% Net Income Margin % 1,837.00 $ Common Stock Share Price at each Year-End 1,182.35$ 370,971.5 Total Equity Value (- share price x shares) 918,500.0 $ 582,898.6 $ Price Earnings Ratio (PIE) 192.19 ahowamazcor cconstatic esehtaftff fe4hosaholohi CASH FLOV STATEMENT HIGHLIGHTS Unaudited; Amounts USD1000 For Fiscal Years ending: Dec 31 % Growth vs Prior Year 2018 2017 2016 2018 2017 2,37100 Net Income or (Loss), from Above 10,955.00 $ 3,033.00 $ 261.2% 15,341.00 $ Depreciation and Amortization Expense Other Operating Sources and (Uses) 11,478.00 $ 5,199.00$3,923.00$6,785.00 8,116.00 -42.2% Cash Flow from Operating Activities 31,495.00 $ 18,434.00 $ 17,272.00 Purchases of property & equip., & other capital expenditures Other InvestingActivities (13,427.00) $ (11,955.00) $ 13,972.00 11944.8% (9,876.00) Cash Flow from Investing Activities (12,369.00) (27819.00 Increase oDecrease) in Debt Increase oDecrease) in Common Stock 14,859.00 $ 5465.2% Dividend Pauments 4,999.001 4,007.001 CASH FLOV STATEMENT HIGHLIGHTS Unaudited; Amounts USD1000 For Fiscal Years ending: Dec 31 % Growth vs Prior Year 2018 2017 2016 2018 2017 10,955.00$ 2612% Net Income or (Loss), from Above 3,033.00 $ 2,371.00 33.7% Depreciation and Amortization Expense Other Operating Sources and (Uses) 5,34100 $ 11,478.00 $ 5,199.00$3,923.00$6,785.00 8,116.00 -42.2% 70,9% 17,272.00 Cash Flow from Operating Activities 31,495.00 $ 18,434.00 $ (13,427.00) 12.3% Purchases of property & equip., & other capital expenditures Other Investing Activities (11,955.00) $ (13.972.00) 11944.8% (9.876.00) Cash Flow from Investing Activities (12,369.00) $ (27,819.00) $ 181.7% 14,859.00$ 99.3% Increase oDecrease) in Debt Increase oDecrease) in Common Stock Dividend Payments Other Financing 54 65.2% 0.0% 55.8% (7,786.00) $ (4,999.00) $ (4,007.00) 0.0% 100.0% Activities 178.0% Cash Flow from Financing Activities 9,860.00 $ (2,911.00) 438.7% (7686.00 436.3% Cumulative Translation Adjustment 100.0% 11,440.00 863,0% NET CASHFLOW 4,273.00 -72.2% 18,068.00$ 10,535.00 178.9% MMemo: Free Cash Flow 6,479.00 . about amazoncom/static-files/ce3bl3ag-4bf1-4388-89a0-e4bd4 abd07b8 BALANCE SHEET HIGHLIGHTS Unaudited; Amounts USD1000 For Fiscal Years ending: Dec 31 % Growth vs Prior Year 2018 2017 2016 2018 2017 Current Assets 54.7% Cash & cash equivalents 20,522.00 $ 31,750.00 $ 43,351.00 $33,675.00 19,334.00 26.447 9.3% All Other Current Assets 4.8% Total Current Assets 45,781.00 Non-current Assets Property. Plant and Equipment, Net 61,797.00 $ 11.202008.83r-00 87.547.00iSO 48,866.00 $ 29,114.00 4.723.00 Other Non-current Assets 37,621.00 Total Non-current Assets 71,113.00 TOTAL ASSETS 162,648.00 $ 131,310.00 $ 83,402.00 Current Liabilities 10.3% Accounts Payable, Net Other Cret Liabilities 23,26700 3.000 30,199.00 18,507.00 25.7% 18.2% Total Current Liabilities 68,391.00 $ 57,883.00 $ 43,816.00 Non-current Liabilities 5,0% 24,743.00 $ 7,694.00 221.6% 23,495.00 166.6% Other Non-current Liabilities $13,965.00) $20,975.00 $ 12,607.00 $9,530.00 45,71800$20,301.00 Total Non-current Liabilities 79.2% -24.8% TOTAL LIABILITIES 77,921.00 $ 103,601.00 $ 64,117.00 Current Liabilities 10.3% 38,192.00 $ Accounts Payable, Net Other Cret Liabilities 25,309.00 23,267.00 $18.507.00 30,199.00 25.7% 57,883.00 18.2% Total Current Liabilities 68,391.00 $ 43,816.00 Non-current Liabilities 5,0% 24,743.00 $ $13,965.00) $20,975.00 $ 9,530.00,00 7,694.00 221.6% Long-term Debt Other Non-current Liabilities 23,495.00 $ 166.6% 12,607.00 Total Non-current Liabilities 79.2% -24.8% TOTAL LIABILITIES 77,921.00 $ 103,601.00 $ 64,117.00 SHAREHOLDERS EQUITY 5,000.00 $ Common Stock, at par Additional Paid-in Capital Retained Earnings Cumulative Translation Adjustment and Other 5,000.00 $ 5,000.00 26,791.00 $ 21,389.00 $ 17,186.00 19,625.00 $ 8,636.00 $ 867.00 TOTAL SHAREHOLDERS EQUITY 43,549.00 $ 27,709.00 $ 19,285.00 Totl Liabilities Total Shareholders Equit 121,470.00 $ 131,310.00 $ M. about amazon comist atic-files/ceIt.;3a3-4b 4388-83a0-e4bd4 abd07b8 SELECTED FINANCIAL RATIOS Unaudited; Amounts USD1000 For Fiscal Years ending: Dec 31 % Growth vs Prior Year 2018 2017 2016 2018 2017 FINANCIAL RATIOS 22.8% Price Earnings Ratio 192.2 48% Debt Ratio 79% 77% 52.1% Total DebtEquity Ratio Return on Equity [ROE) % Return on Assets(ROA) % Net Profit Margin % 10.9% 12.3% 129.8% 25.2% 67% 2.8% 175.9% 4.7% 1.7% 1.7% -2.2% 178.9% 10,535.00 Free Cash Flow 18,068.00 $ 6,479.00 OTHERUSEFUL RATIOS 4.8988 2561% 25.6% Earnings per Share or EPS 21.9100 $ Current Ratio 1.1 COMMONSTOCK PRICE Adjusted Close Price on or near Dec 31 1,837.00 $ 1,182.35 $ 766.47 RATE OF RETURN CALCULATIONS 2015 2016 2017 2018 Pct Change 675.89$ 749.87 171.8% Adjusted Close Stock Price at fiscal End of Year (EOY) Annual Dividends per Share If you buy 1share at end of fiscal 2015, collect dividends, then sell at end of fiscal 2018, your 3-year percent gain would be 1,169.47$ 1837.00 (15.5720) (8.2789) $ 166.8% BUT YHAT IF YE YIEY THIS AS A TIME YALUE OF MONEY QUESTION? (675.89) $ 8.28) Inuestor's Annual Cash Flow for 1 Share 1,821.43 Solue for the annual Internal Rate of Return or IRR, with N-3 Yrs
Step by Step Solution
There are 3 Steps involved in it

Get step-by-step solutions from verified subject matter experts