

Question: please provide help with activity ratios Activity Ratios - Inventory Turnover - Accounts Receivables Turnover - Total Asset Turnover - Average Collection Period 3. Using
please provide help with activity ratios
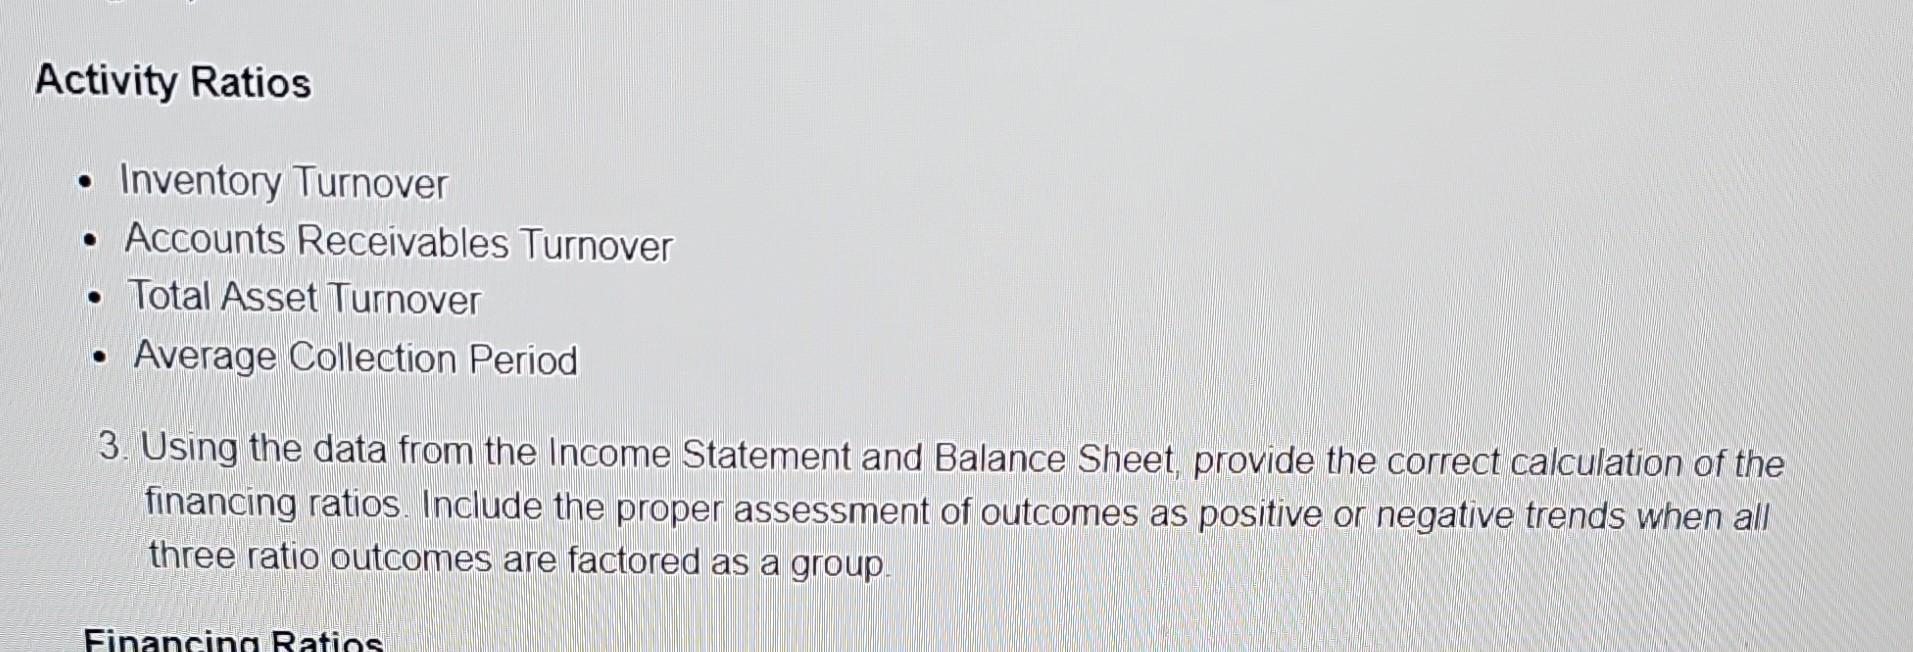
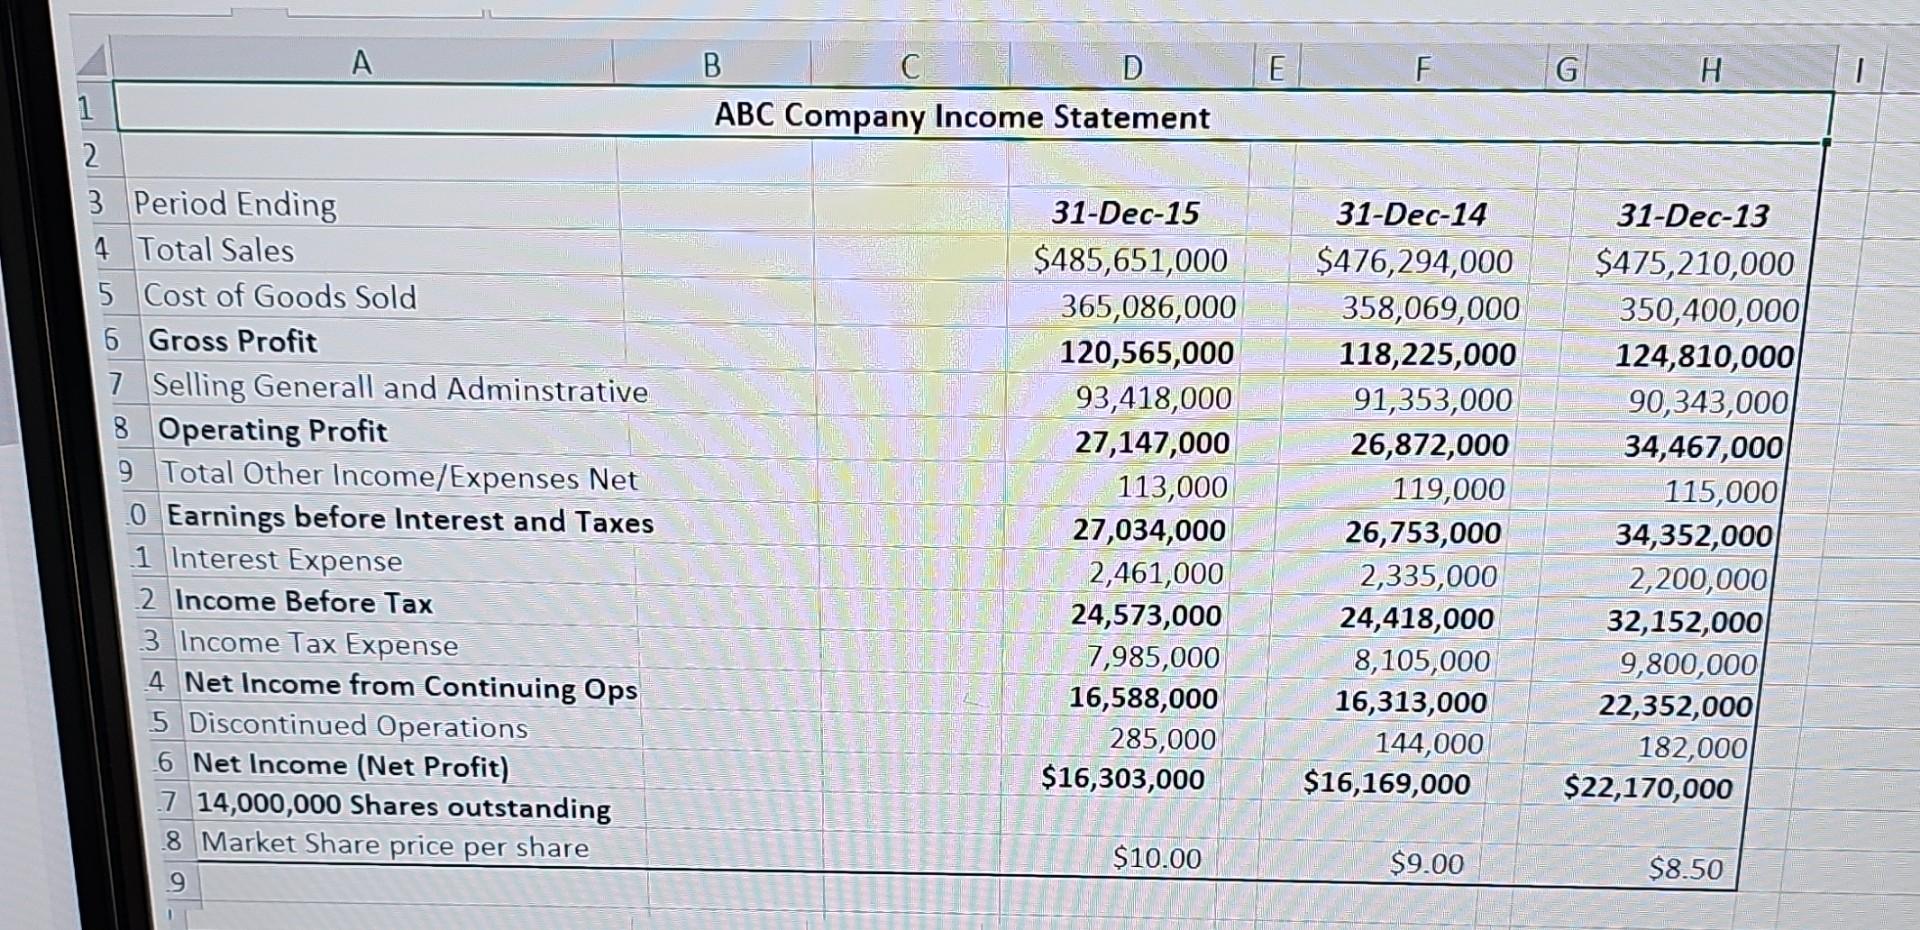
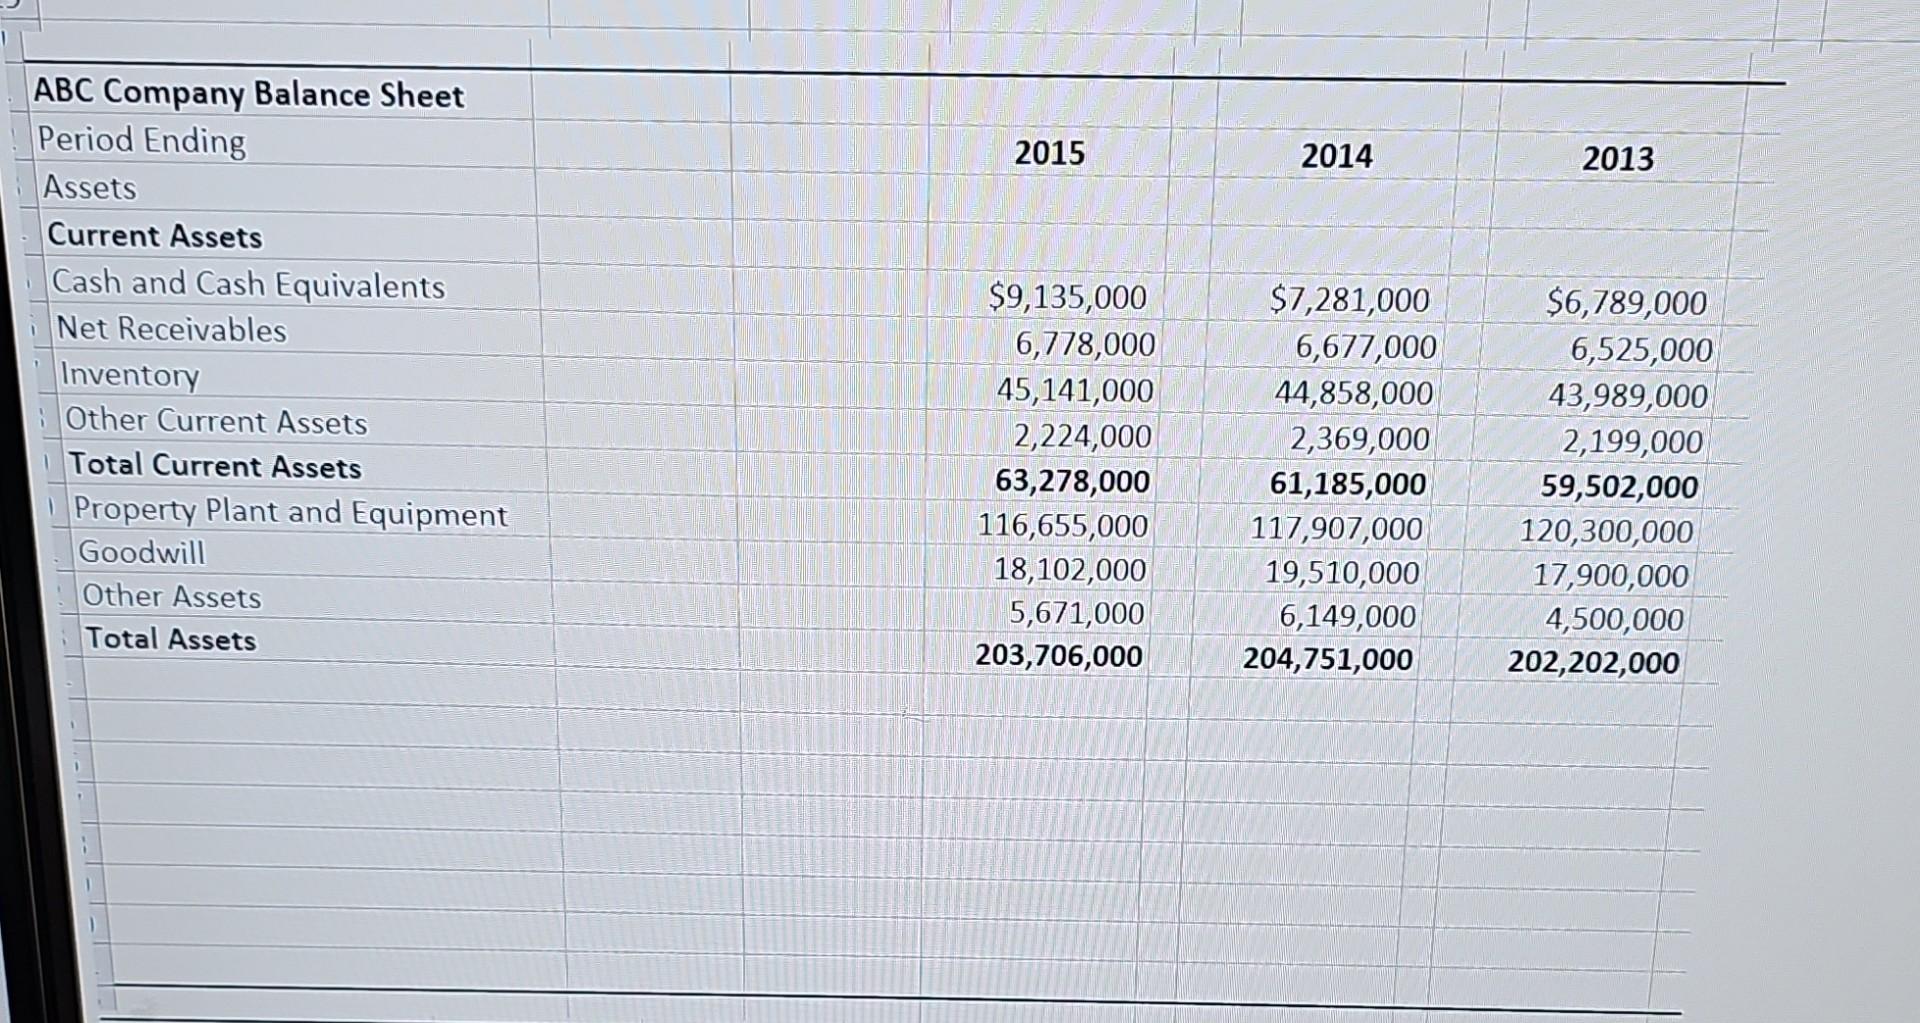
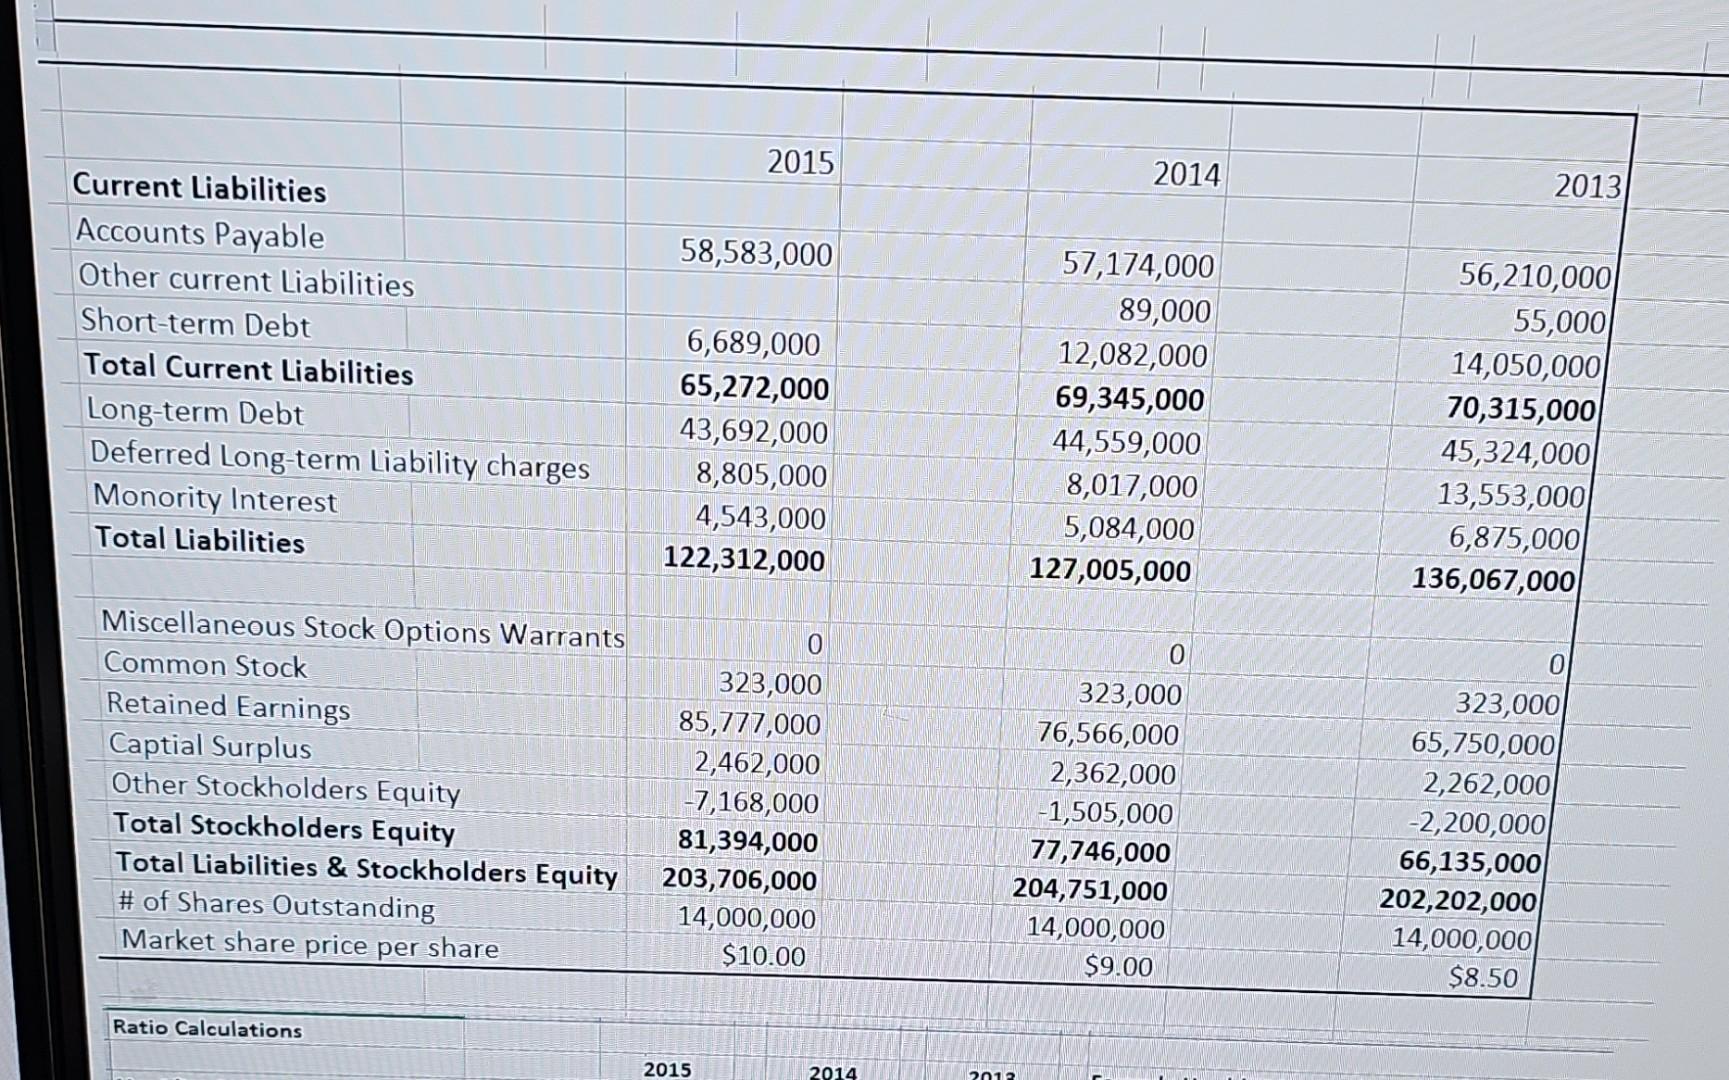
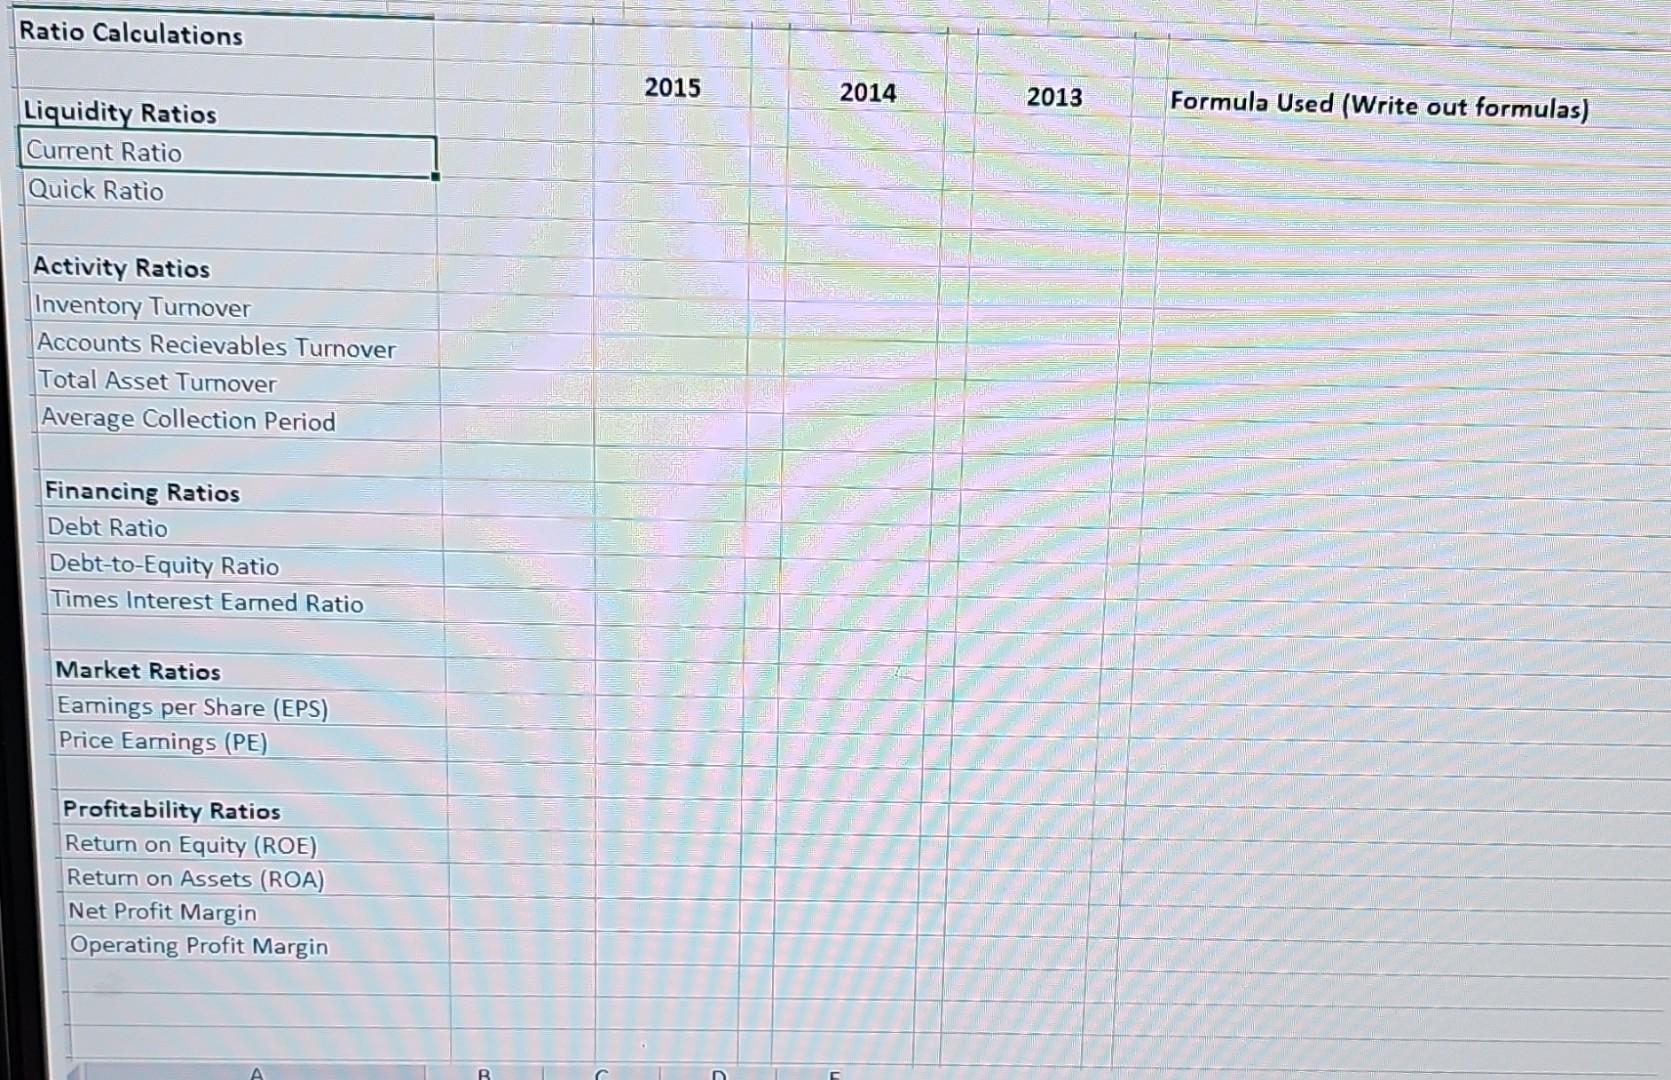
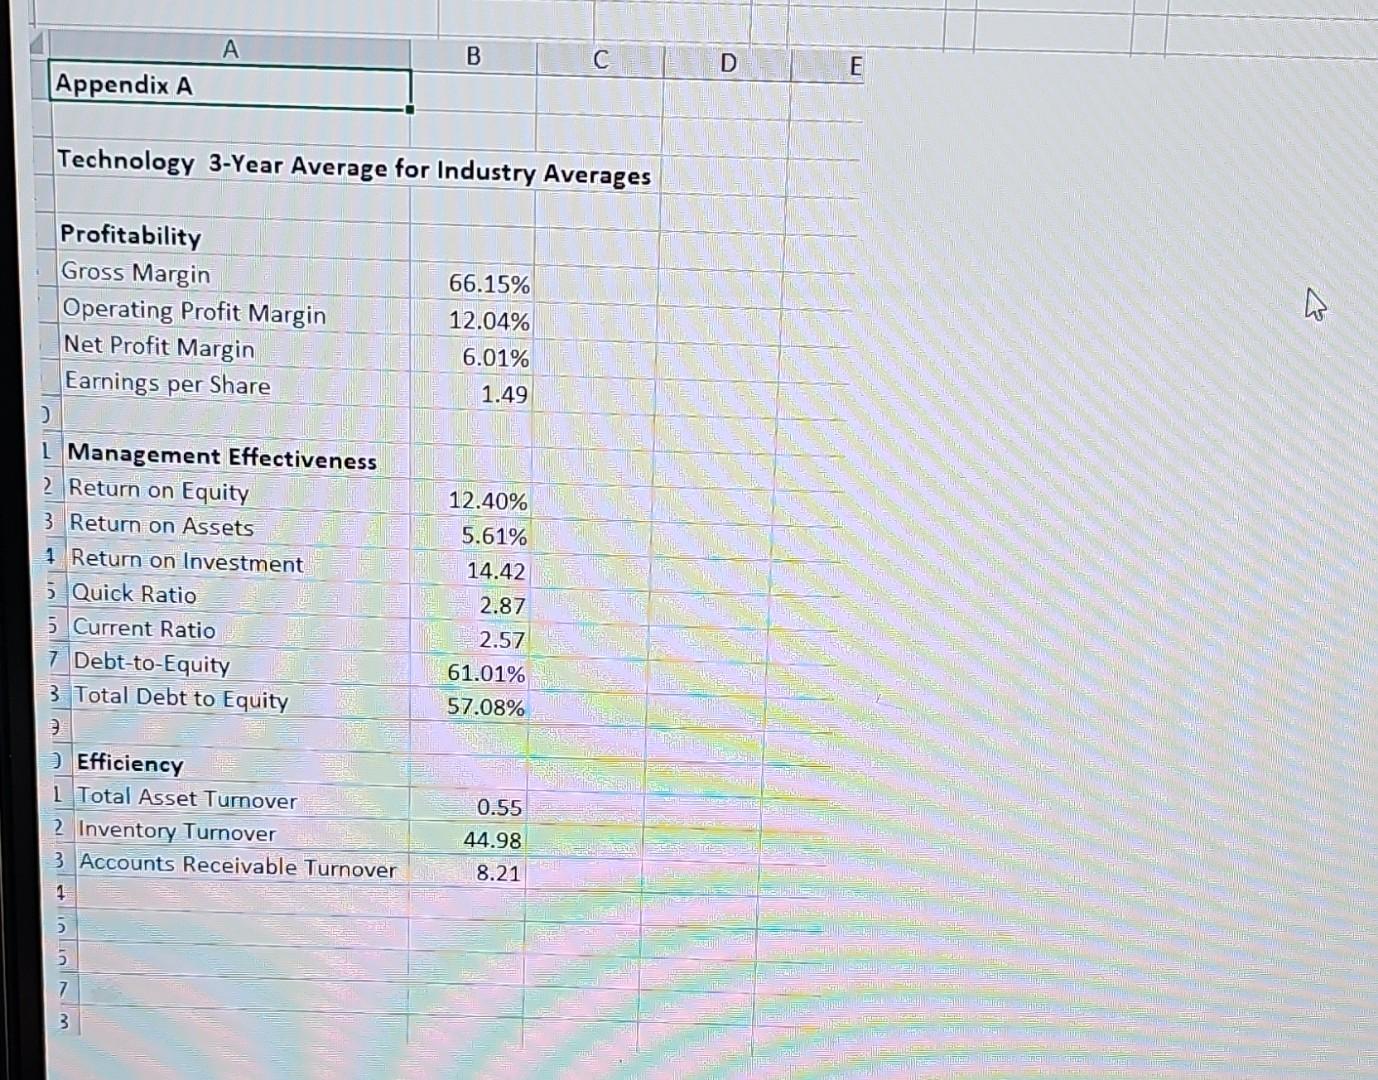
Activity Ratios - Inventory Turnover - Accounts Receivables Turnover - Total Asset Turnover - Average Collection Period 3. Using the data from the Income Statement and Balance Sheet, provide the correct calculation of the financing ratios. Include the proper assessment of outcomes as positive or negative trends when all three ratio outcomes are factored as a group. \begin{tabular}{|l|r|r|r|} \hline ABC Company Balance Sheet & & & \\ \hline Period Ending & 2015 & 2014 & \multicolumn{1}{|c|}{2013} \\ \hline Assets & & & \\ \hline Current Assets & & & \\ \hline Cash and Cash Equivalents & $9,135,000 & $7,281,000 & $6,789,000 \\ \hline Net Receivables & 6,778,000 & 6,677,000 & 6,525,000 \\ \hline Inventory & 45,141,000 & 44,858,000 & 43,989,000 \\ \hline Other Current Assets & 2,224,000 & 2,369,000 & 2,199,000 \\ \hline Total Current Assets & 63,278,000 & 61,185,000 & 59,502,000 \\ \hline Property Plant and Equipment & 116,655,000 & 117,907,000 & 120,300,000 \\ \hline Goodwill & 18,102,000 & 19,510,000 & 17,900,000 \\ \hline Other Assets & 5,671,000 & 6,149,000 & 4,500,000 \\ \hline Total Assets & 203,706,000 & 204,751,000 & 202,202,000 \\ \hline & & & \\ \hline & & & \\ \hline & & & \\ \hline & & & \\ \hline \end{tabular} \begin{tabular}{|l|r|r|r|} \hline & & & \\ \hline Current Liabilities & 2015 & 2014 & 2013 \\ \hline Accounts Payable & & & \\ \hline Other current Liabilities & 58,583,000 & 57,174,000 & 56,210,000 \\ \hline Short-term Debt & 6,689,000 & 89,000 & 55,000 \\ \hline Total Current Liabilities & 65,272,000 & 12,082,000 & 14,050,000 \\ \hline Long-term Debt & 43,692,000 & 69,345,000 & 70,315,000 \\ \hline Deferred Long-term Liability charges & 8,805,000 & 44,559,000 & 45,324,000 \\ \hline Monority Interest & 4,543,000 & 8,017,000 & 13,553,000 \\ \hline Total Liabilities & 122,312,000 & 5,084,000 & 6,875,000 \\ \hline & & 127,005,000 & 136,067,000 \\ \hline Miscellaneous Stock Options Warrants & & & 0 \\ \hline Common Stock & 323,000 & 0 & 0 \\ \hline Retained Earnings & 85,777,000 & 323,000 & 65,750,000 \\ \hline Captial Surplus & 2,462,000 & 76,566,000 & 2,262,000 \\ \hline Other Stockholders Equity & 7,168,000 & 2,362,000 & 2,200,000 \\ \hline Total Stockholders Equity & 81,394,000 & 1,505,000 & 66,135,000 \\ \hline Total Liabilities \& Stockholders Equity & 203,706,000 & 77,746,000 & 202,202,000 \\ \hline \# of Shares Outstanding & 14,000,000 & 204,751,000 & 14,000,000 \\ \hline Market share price per share & $10.00 & 14,000,000 & $8.50 \\ \hline & $9.00 & \\ \hline Ratio Calculations & & & \\ \hline \end{tabular} Technology 3-Year Average for Industrv Averages
Step by Step Solution
There are 3 Steps involved in it

Get step-by-step solutions from verified subject matter experts