

Question: Please provide Matlab code program AND the 2 contour plots for the two different initial starting points. Make sure your code can be run too.
Please provide Matlab code program AND the contour plots for the two different initial starting points. Make sure your code can be run too. Also, figure is the sample plot for a different fx
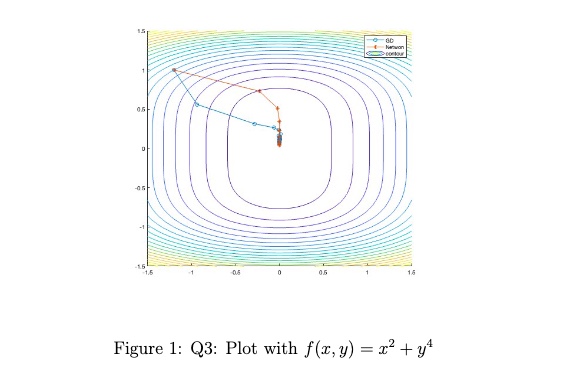
Program the gradient descent and Newton algorithms using the backtracking line search Procedure below, set Use them to minimize the Rosenbrock function
First try the initial point ; and then the more difficult point
; Plot the contour of the function and then plot the path of
iterates obtained by each method on the contour. You can use 'help contour'
and 'help plot' to find instructions of using 'contour' and 'plot'. A possible
way to plot with one initial point is given below.
Procedure Backtracking Line Search
Choose ; Set ;
repeat until
;
end repeat
Terminate with
Figure : Q: Plot with
Step by Step Solution
There are 3 Steps involved in it
1 Expert Approved Answer
Step: 1 Unlock

Question Has Been Solved by an Expert!
Get step-by-step solutions from verified subject matter experts
Step: 2 Unlock
Step: 3 Unlock