

Question: please provide me the correct answer Part 1 Vertical, Horizontal, and Ratio Analysis (40 marks) Amiga Holdings Inc. is a manufacturer and distributor of imaging
 please provide me the correct answer
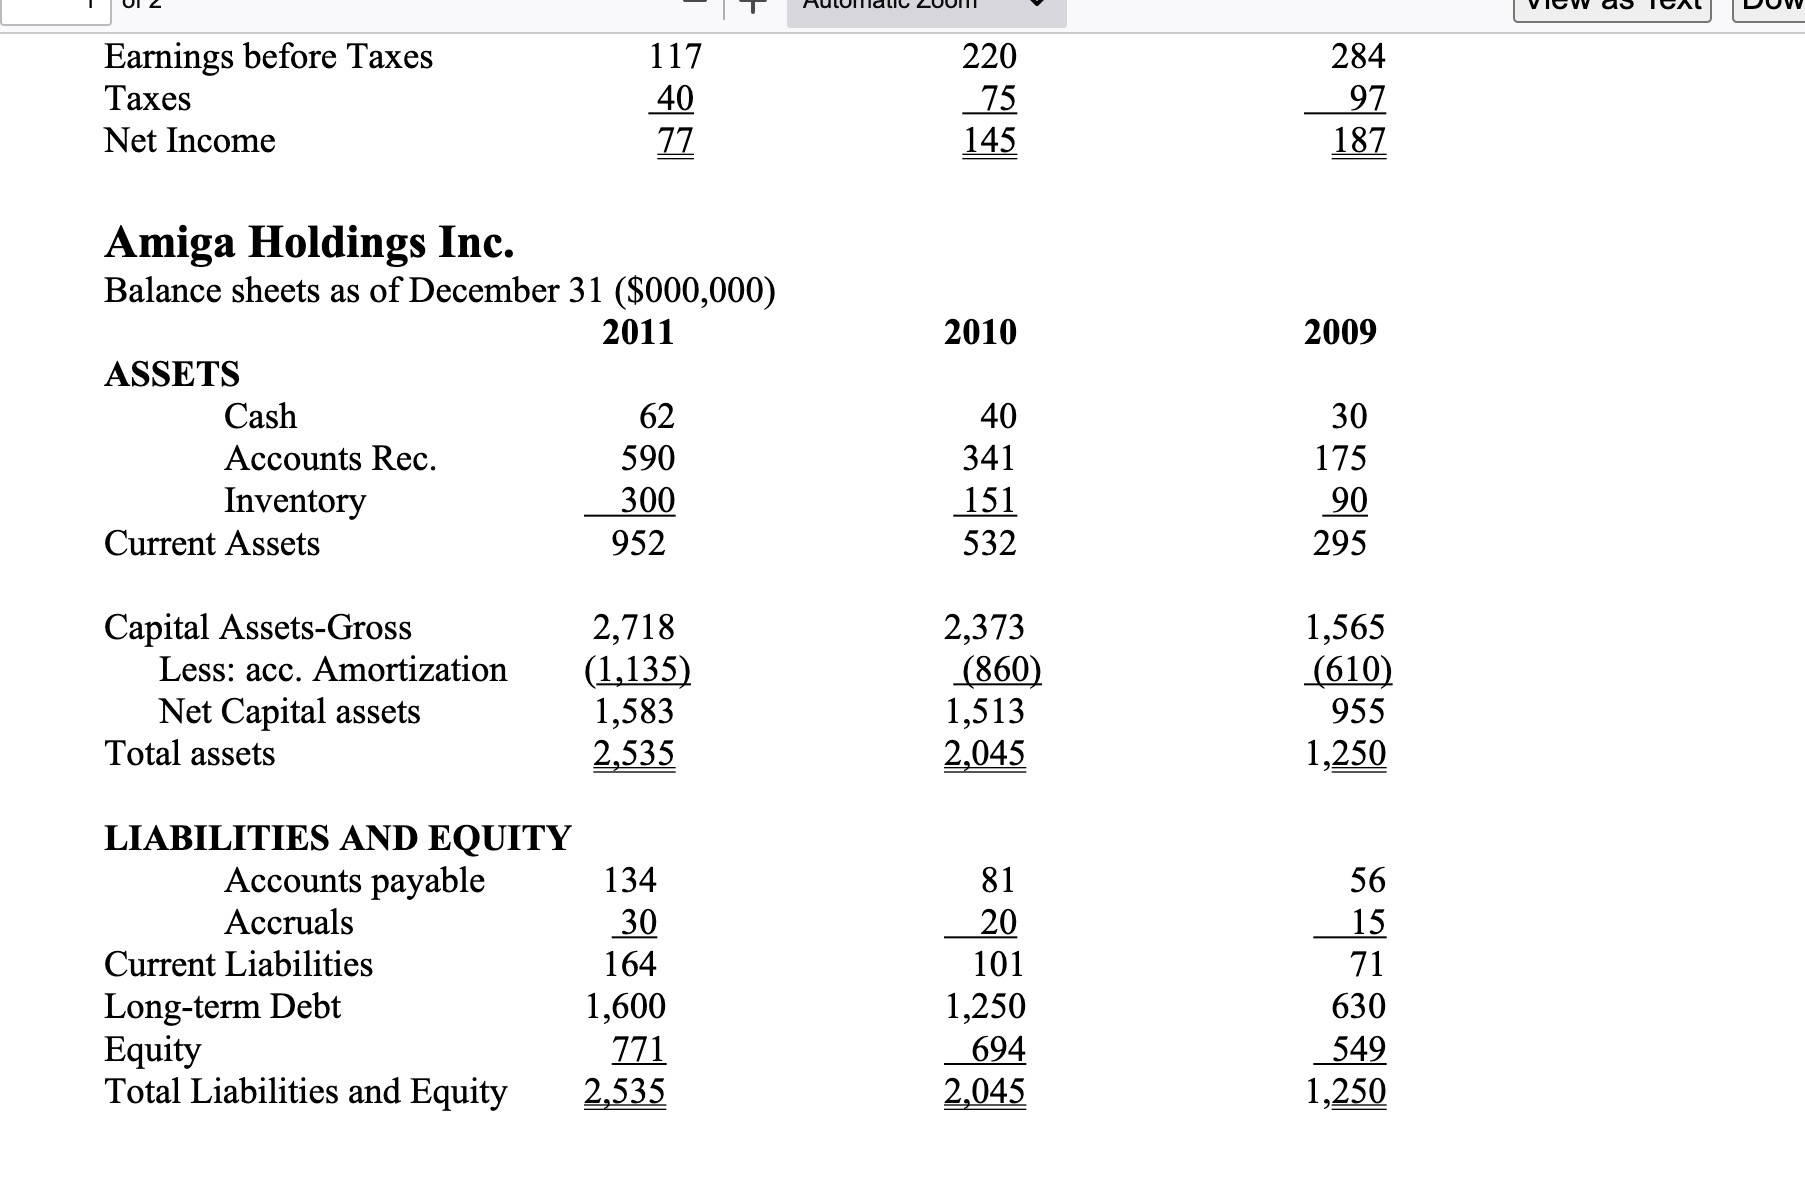
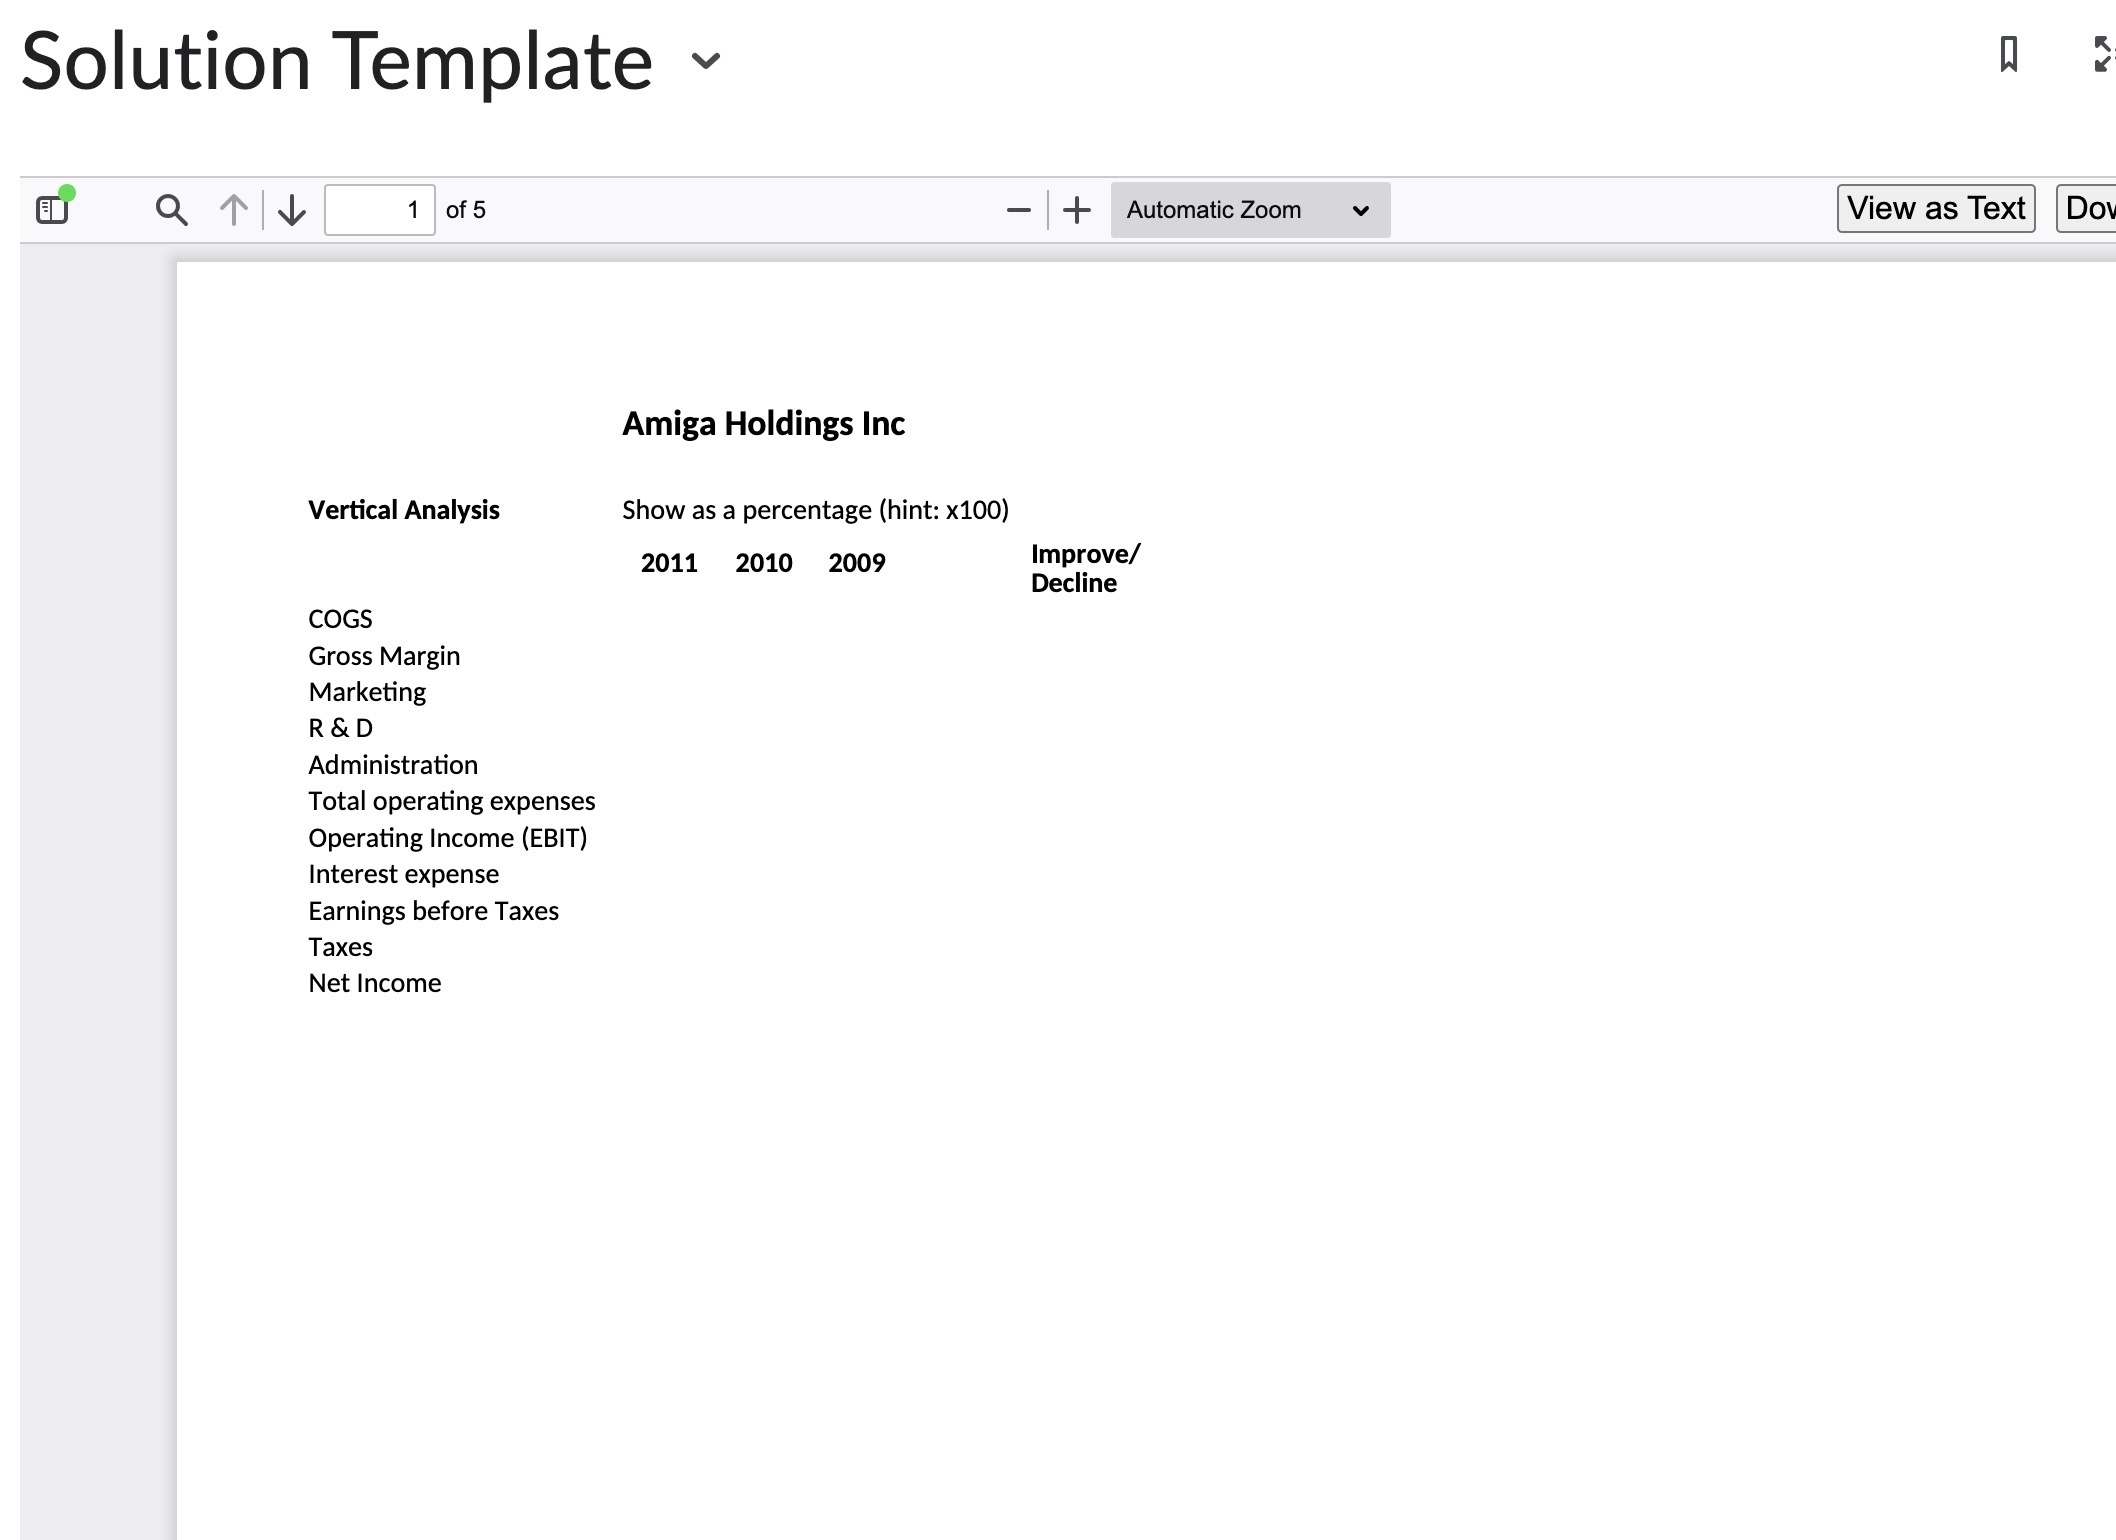

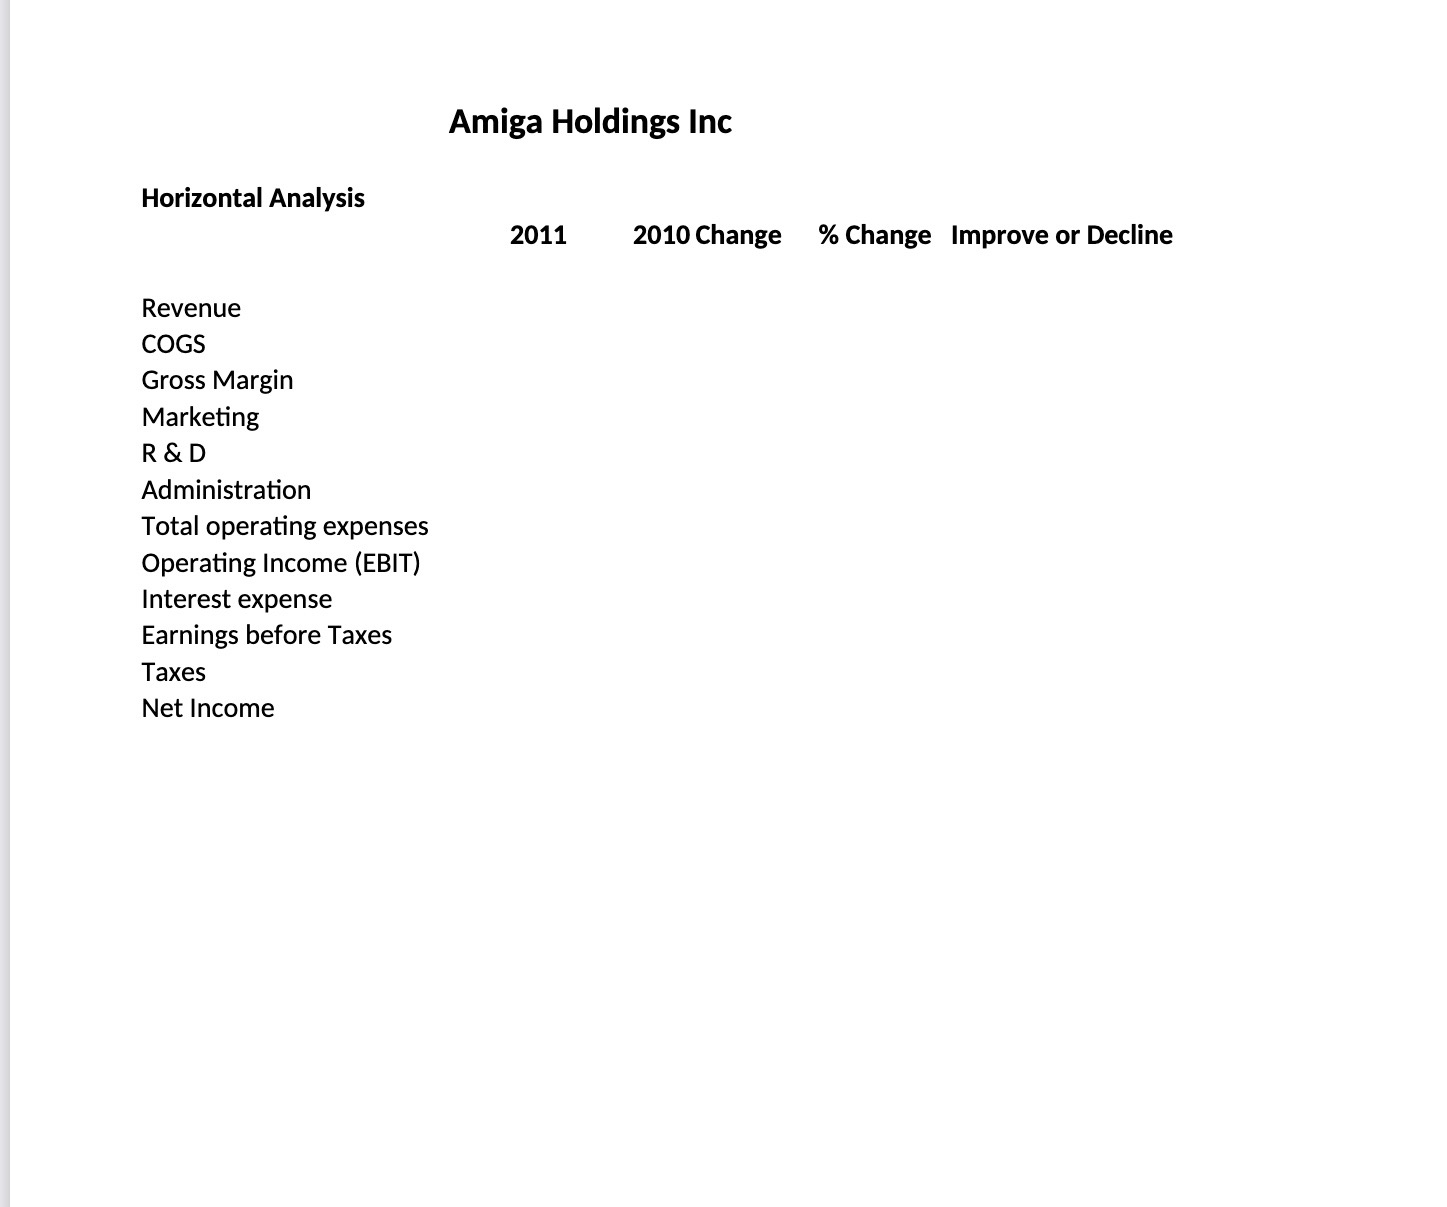
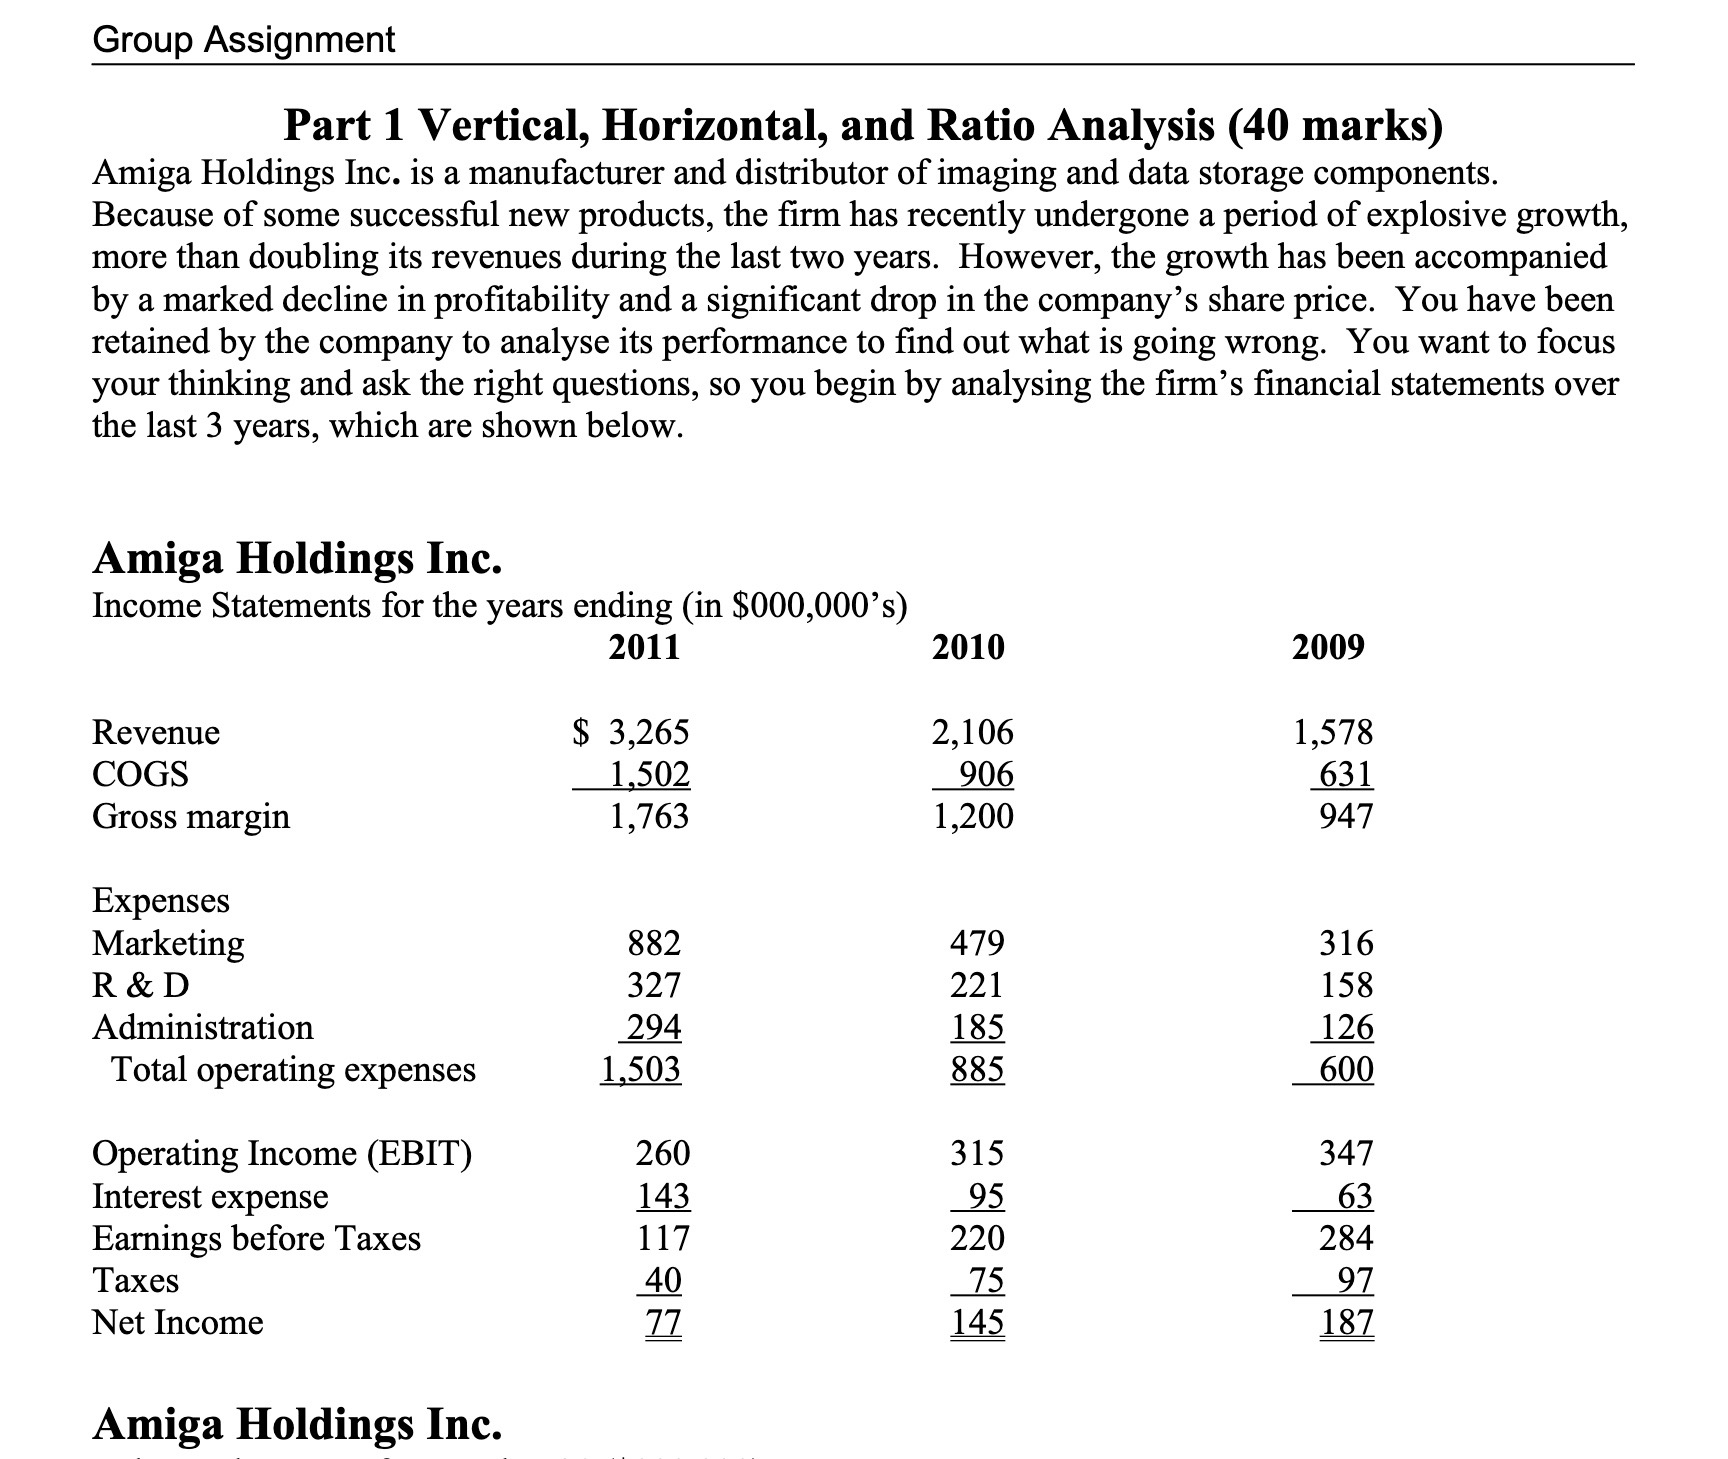
Part 1 Vertical, Horizontal, and Ratio Analysis (40 marks) Amiga Holdings Inc. is a manufacturer and distributor of imaging and data storage components. Because of some successful new products, the firm has recently undergone a period of explosive growth, more than doubling its revenues during the last two years. However, the growth has been accompanied by a marked decline in profitability and a significant drop in the company's share price. You have been retained by the company to analyse its performance to find out what is going wrong. You want to focus your thinking and ask the right questions, so you begin by analysing the firm's financial statements over the last 3 years, which are shown below. Amiga Holdings Inc. EarningsbeforeTaxesTaxesNetIncome11740772207514528497187 Amiga Holdings Inc. Balance sheets as of December 31($000,000) 2011 ASSETS 2010 \begin{tabular}{rr} 40 & 30 \\ 341 & 175 \\ 151 \\ \hline 532 & 990 \\ \hline \end{tabular} 2,373 1,513(860) 2,045 81201011,2506942,045 2009 \begin{tabular}{r} 30 \\ 175 \\ 29590 \\ 1,565 \\ (610) \\ \hline 955 \\ 1,250 \end{tabular} 5615716305491,250 Use the provided Excel template. (include your calculations in the cells to show your work) (a) Prepare a vertical analysis in Excel for the income statements for 2009, 2010 and 2011. Analyse the trend for each line in the income statement. Explain whether the vertical analysis indicates an improvement or deterioration for each account. (15 marks) (b) Prepare a horizontal analysis in Excel for the income statements for 2010 and 2011. Analyse the trend for each line in the balance sheet and explain whether the horizontal analysis indicates an improvement or deterioration for each account. (10 marks) (c) Use the provided template and textbook formulas to calculate the indicated ratios for all three years in Excel. Analyse the trends in each ratio and compare each with the industry average. What can you deduce from this information? Comment on each ratio and give an idea about what might be going on. (10 marks) Solution Template a/ 1 of 5 Amiga Holdings Inc Hint: remember to include units for each ratio Amiga Holdings Inc
Step by Step Solution
There are 3 Steps involved in it

Get step-by-step solutions from verified subject matter experts