

Question: Please provide R code will upvote if done correctly 3) Last, we will compare relationships between the percentage of students from the top 10% of
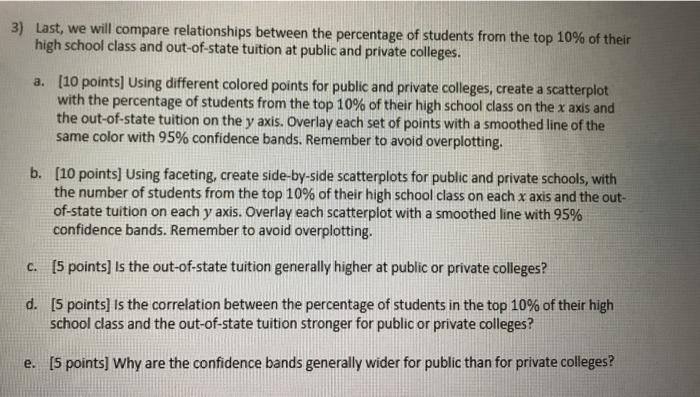

3) Last, we will compare relationships between the percentage of students from the top 10% of their high school class and out-of-state tuition at public and private colleges. a. [10 points] Using different colored points for public and private colleges, create a scatterplot with the percentage of students from the top 10% of their high school class on the x axis and the out-of-state tuition on the y axis. Overlay each set of points with a smoothed line of the same color with 95% confidence bands. Remember to avoid overplotting. b. (10 points] Using faceting, create side-by-side scatterplots for public and private schools, with the number of students from the top 10% of their high school class on each x axis and the out- of-state tuition on each y axis. Overlay each scatterplot with a smoothed line with 95% confidence bands. Remember to avoid overplotting. C. (5 points) is the out-of-state tuition generally higher at public or private colleges? d. [5 points) is the correlation between the percentage of students in the top 10% of their high school class and the out-of-state tuition stronger for public or private colleges? e. [5 points] Why are the confidence bands generally wider for public than for private colleges? Providing your R code is not required, but may be helpful when assigning partial credit. We will be using the College dataset in the ISLR package for this assignment. 3) Last, we will compare relationships between the percentage of students from the top 10% of their high school class and out-of-state tuition at public and private colleges. a. [10 points] Using different colored points for public and private colleges, create a scatterplot with the percentage of students from the top 10% of their high school class on the x axis and the out-of-state tuition on the y axis. Overlay each set of points with a smoothed line of the same color with 95% confidence bands. Remember to avoid overplotting. b. (10 points] Using faceting, create side-by-side scatterplots for public and private schools, with the number of students from the top 10% of their high school class on each x axis and the out- of-state tuition on each y axis. Overlay each scatterplot with a smoothed line with 95% confidence bands. Remember to avoid overplotting. C. (5 points) is the out-of-state tuition generally higher at public or private colleges? d. [5 points) is the correlation between the percentage of students in the top 10% of their high school class and the out-of-state tuition stronger for public or private colleges? e. [5 points] Why are the confidence bands generally wider for public than for private colleges? Providing your R code is not required, but may be helpful when assigning partial credit. We will be using the College dataset in the ISLR package for this assignment
Step by Step Solution
There are 3 Steps involved in it

Get step-by-step solutions from verified subject matter experts