

Question: Please provide relevant Excel operation methods. LA 1 Instructions and Requirements The data file named Stocks have been given - attached. The information about data
Please provide relevant Excel operation methods.
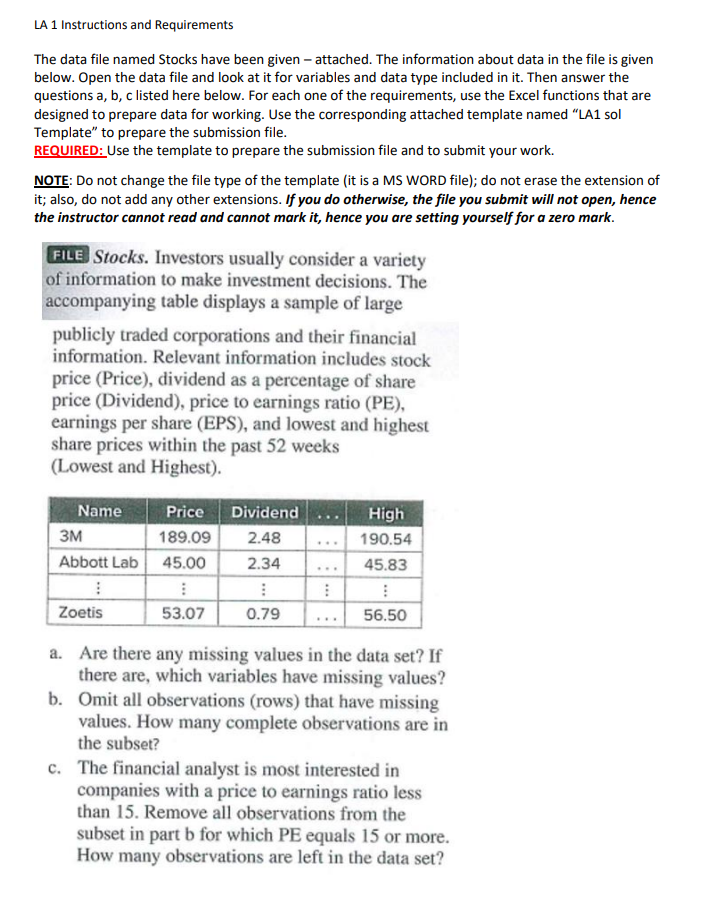
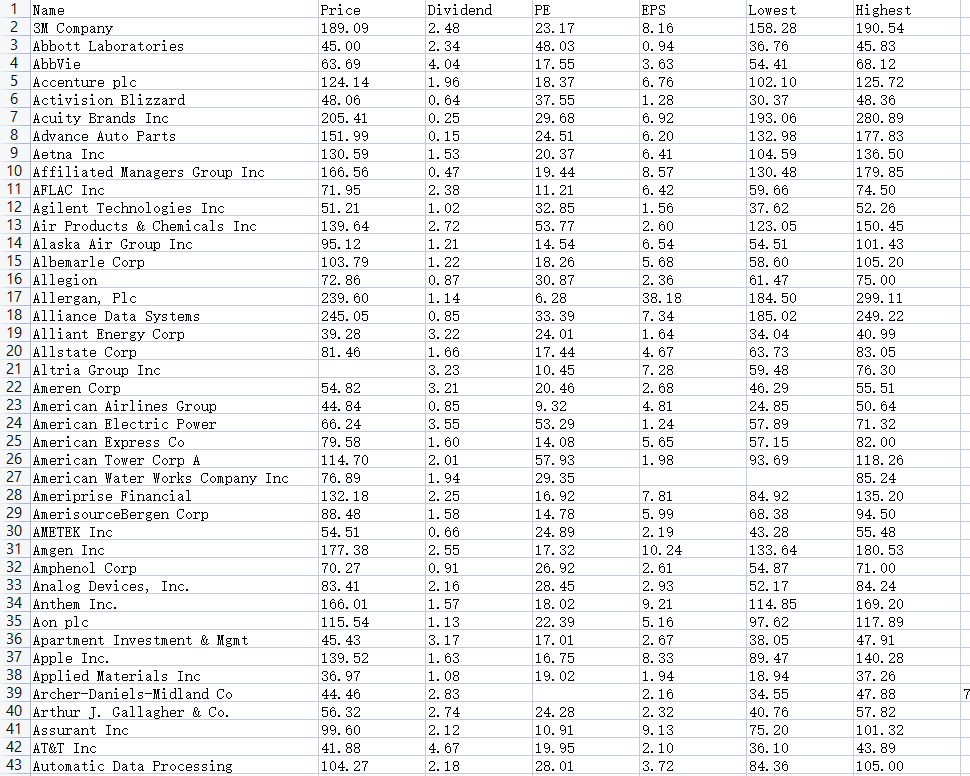
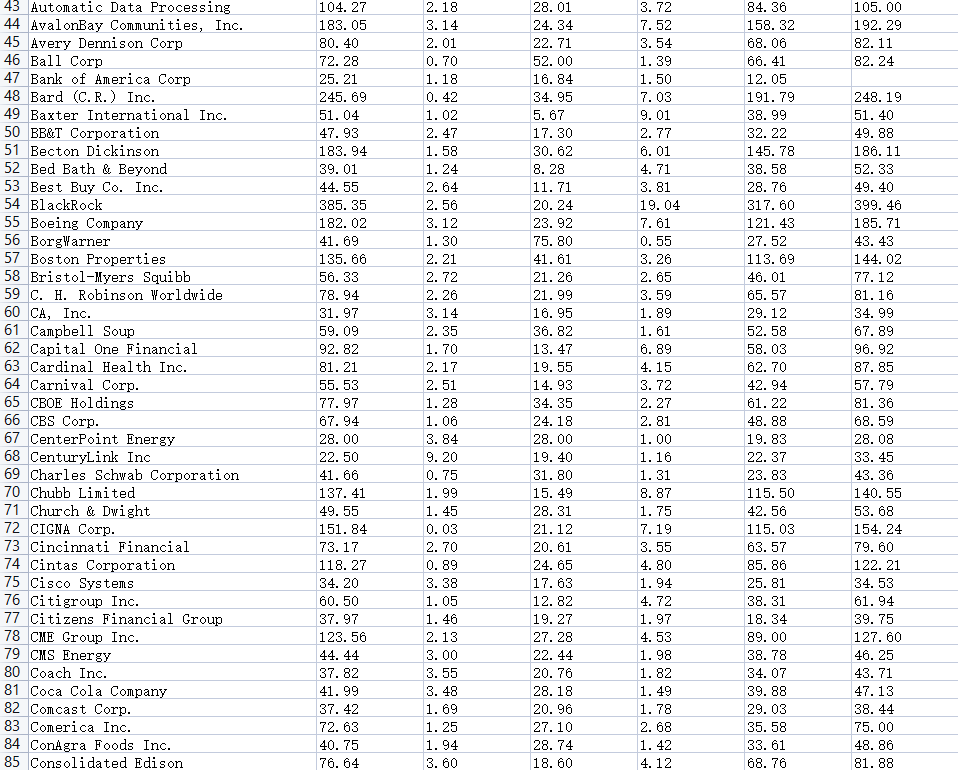
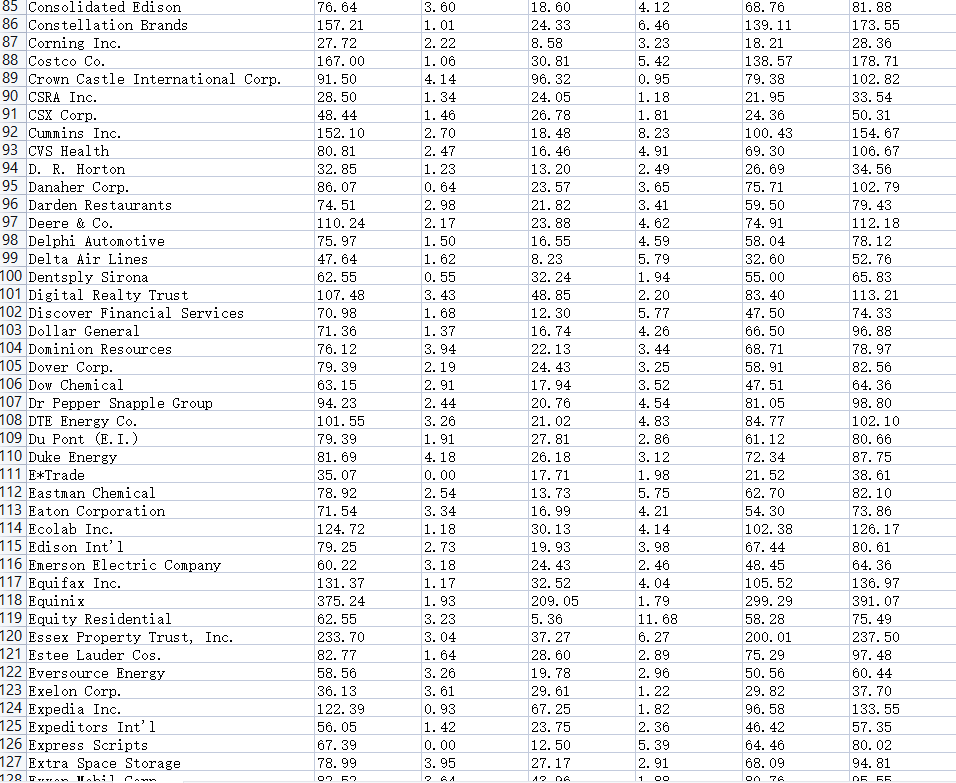
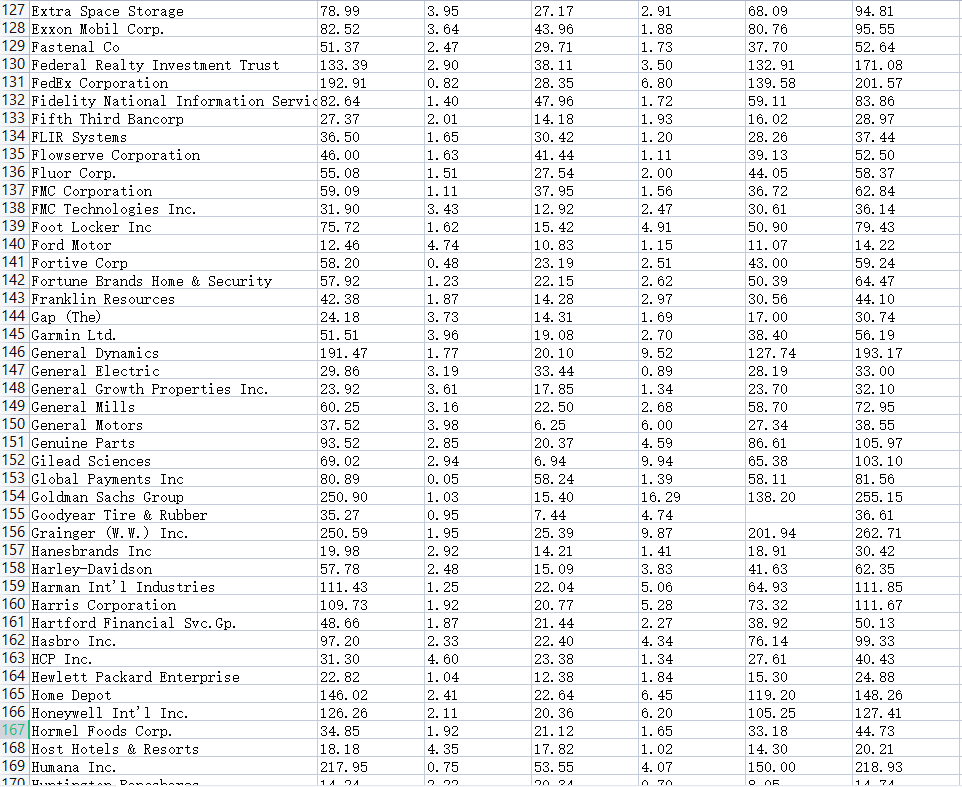
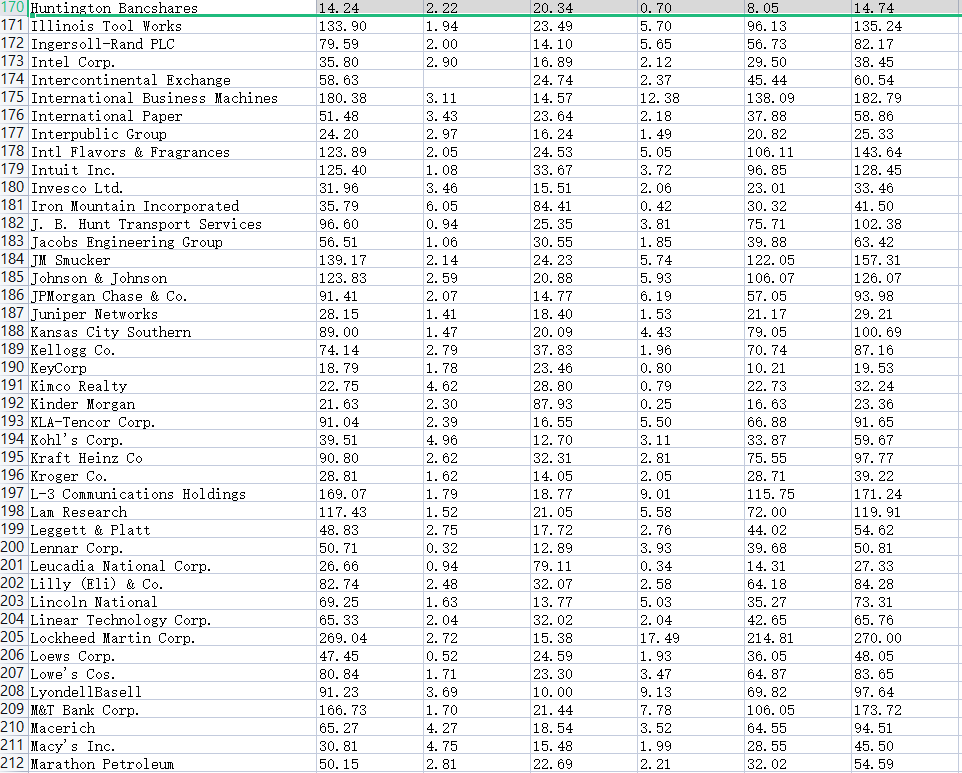
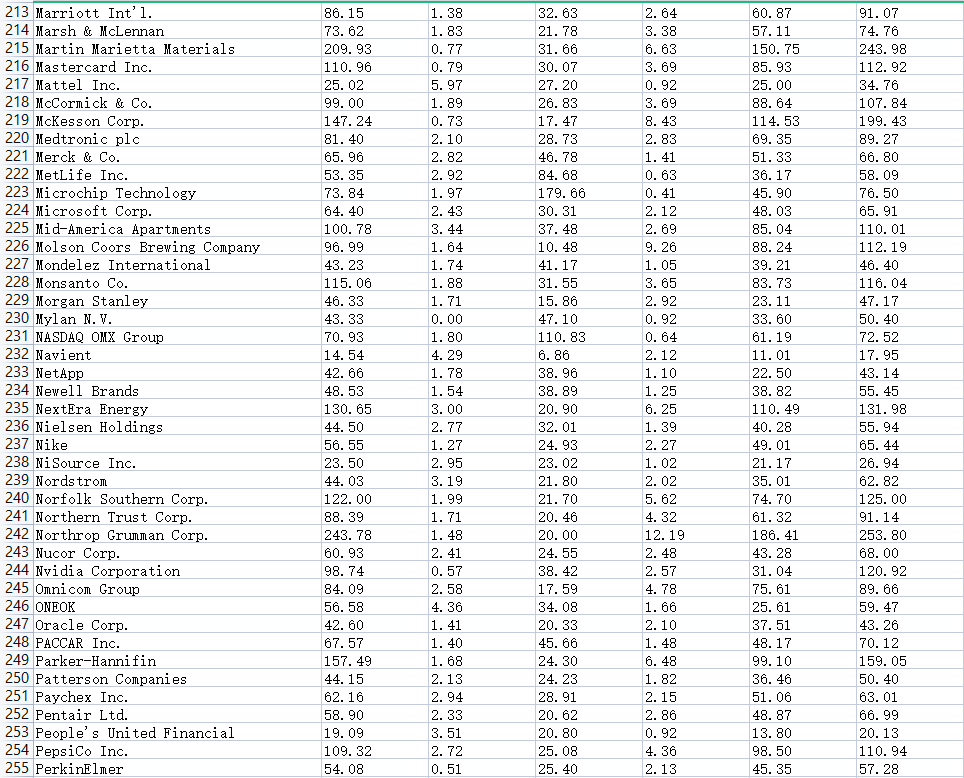
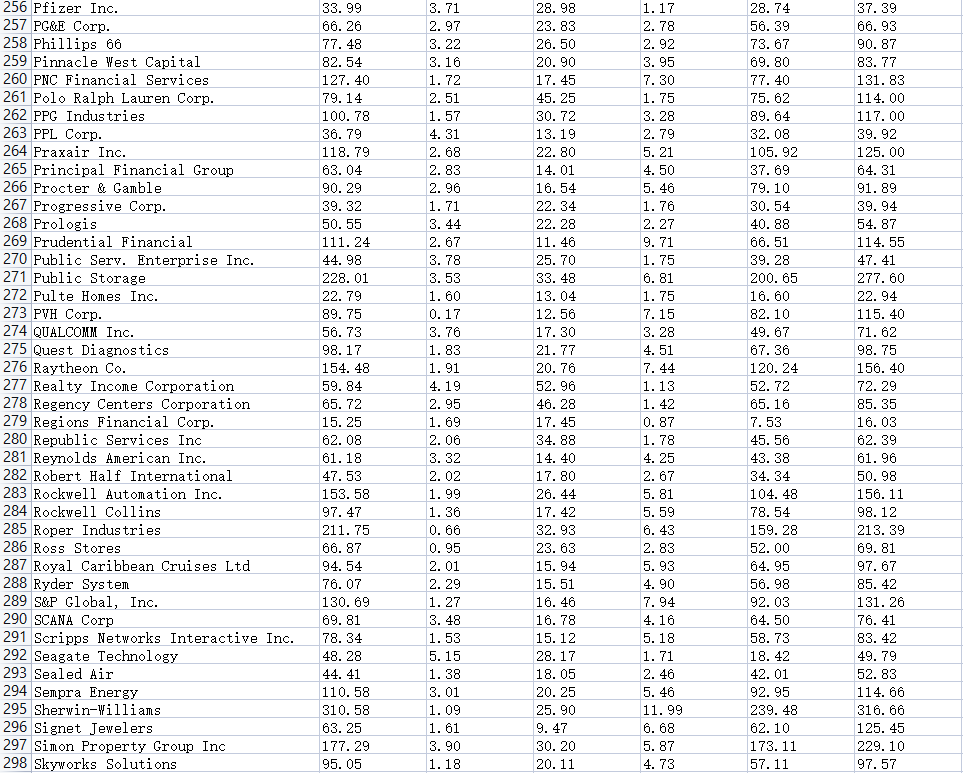
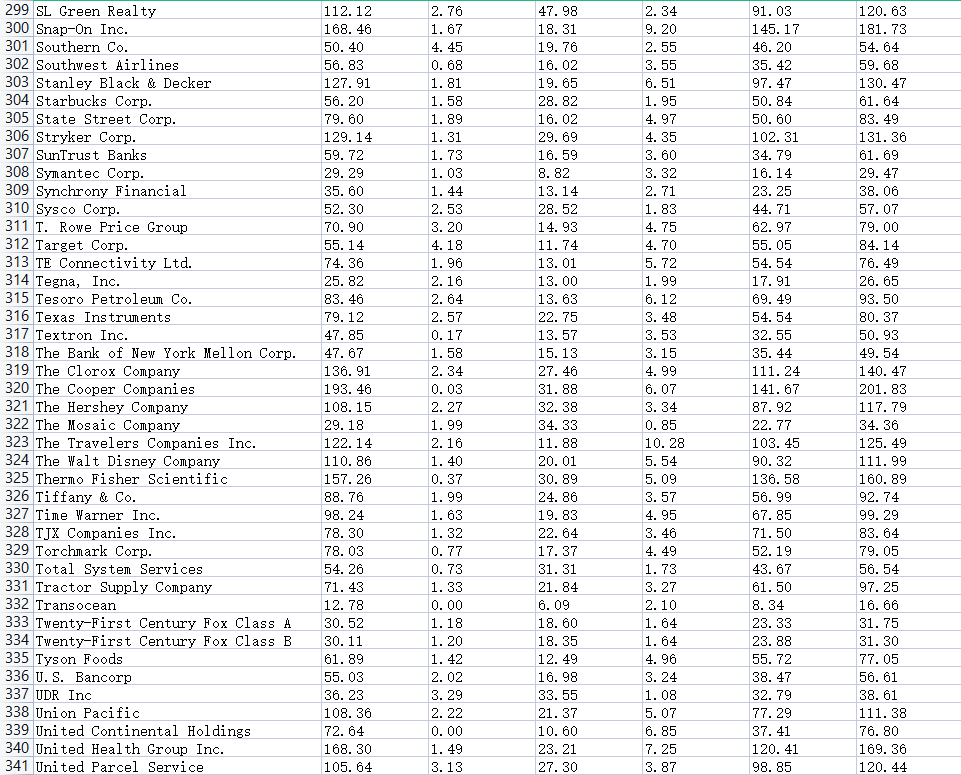
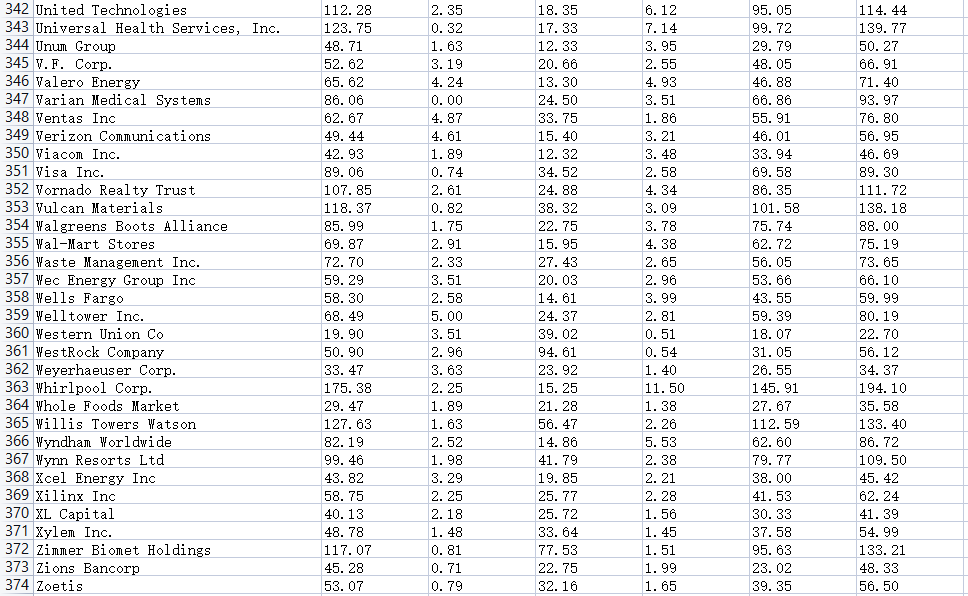
LA 1 Instructions and Requirements The data file named Stocks have been given - attached. The information about data in the file is given below. Open the data file and look at it for variables and data type included in it. Then answer the questions a, b, c listed here below. For each one of the requirements, use the Excel functions that are designed to prepare data for working. Use the corresponding attached template named "LA1 sol Template" to prepare the submission file. REQUIRED: Use the template to prepare the submission file and to submit your work. NOTE: Do not change the file type of the template (it is a MS WORD file); do not erase the extension of it; also, do not add any other extensions. If you do otherwise, the file you submit will not open, hence the instructor cannot read and cannot mark it, hence you are setting yourself for a zero mark. FILE Stocks. Investors usually consider a variety of information to make investment decisions. The accompanying table displays a sample of large publicly traded corporations and their financial information. Relevant information includes stock price (Price), dividend as a percentage of share price (Dividend), price to earnings ratio (PE), earnings per share (EPS), and lowest and highest share prices within the past 52 weeks (Lowest and Highest). a. Are there any missing values in the data set? If there are, which variables have missing values? b. Omit all observations (rows) that have missing values. How many complete observations are in the subset? c. The financial analyst is most interested in companies with a price to earnings ratio less than 15. Remove all observations from the subset in part b for which PE equals 15 or more. How many observations are left in the data set? LA 1 Instructions and Requirements The data file named Stocks have been given - attached. The information about data in the file is given below. Open the data file and look at it for variables and data type included in it. Then answer the questions a, b, c listed here below. For each one of the requirements, use the Excel functions that are designed to prepare data for working. Use the corresponding attached template named "LA1 sol Template" to prepare the submission file. REQUIRED: Use the template to prepare the submission file and to submit your work. NOTE: Do not change the file type of the template (it is a MS WORD file); do not erase the extension of it; also, do not add any other extensions. If you do otherwise, the file you submit will not open, hence the instructor cannot read and cannot mark it, hence you are setting yourself for a zero mark. FILE Stocks. Investors usually consider a variety of information to make investment decisions. The accompanying table displays a sample of large publicly traded corporations and their financial information. Relevant information includes stock price (Price), dividend as a percentage of share price (Dividend), price to earnings ratio (PE), earnings per share (EPS), and lowest and highest share prices within the past 52 weeks (Lowest and Highest). a. Are there any missing values in the data set? If there are, which variables have missing values? b. Omit all observations (rows) that have missing values. How many complete observations are in the subset? c. The financial analyst is most interested in companies with a price to earnings ratio less than 15. Remove all observations from the subset in part b for which PE equals 15 or more. How many observations are left in the data set
Step by Step Solution
There are 3 Steps involved in it

Get step-by-step solutions from verified subject matter experts