

Question: please provide solution in excel with proper table and necessary calculations 2. The following table shows expected rates of return (%) distributions for two securities
please provide solution in excel with proper table and necessary calculations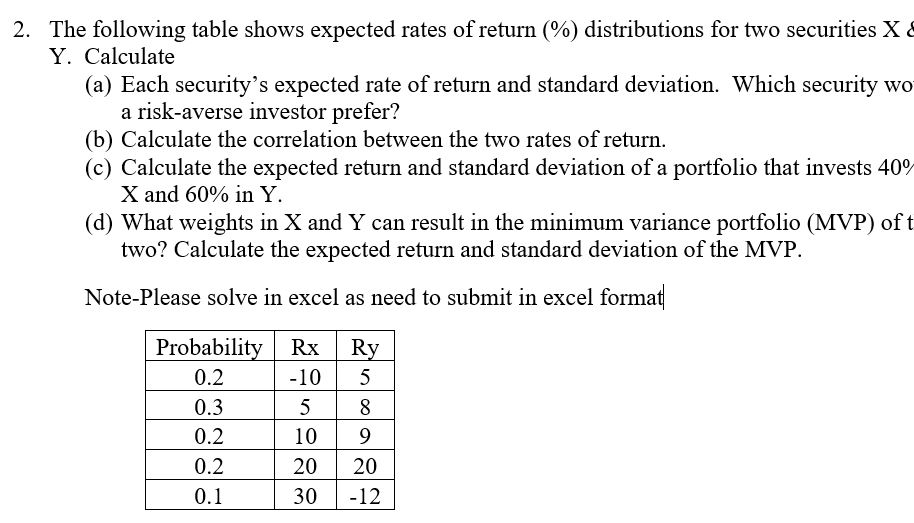
2. The following table shows expected rates of return (\%) distributions for two securities X Y. Calculate (a) Each security's expected rate of return and standard deviation. Which security wo a risk-averse investor prefer? (b) Calculate the correlation between the two rates of return. (c) Calculate the expected return and standard deviation of a portfolio that invests 40 X and 60% in Y. (d) What weights in X and Y can result in the minimum variance portfolio (MVP) of two? Calculate the expected return and standard deviation of the MVP. Note-Please solve in excel as need to submit in excel format
Step by Step Solution
There are 3 Steps involved in it

Get step-by-step solutions from verified subject matter experts