

Question: please provide step by step if possible, thanks!! Problem 1 (Source: http://cba.ualr.edu/smartstat/topics/anova/example.pdf) Suppose the National Transportation Safety Board (NTSB) wants to examine the safety of
please provide step by step if possible, thanks!!
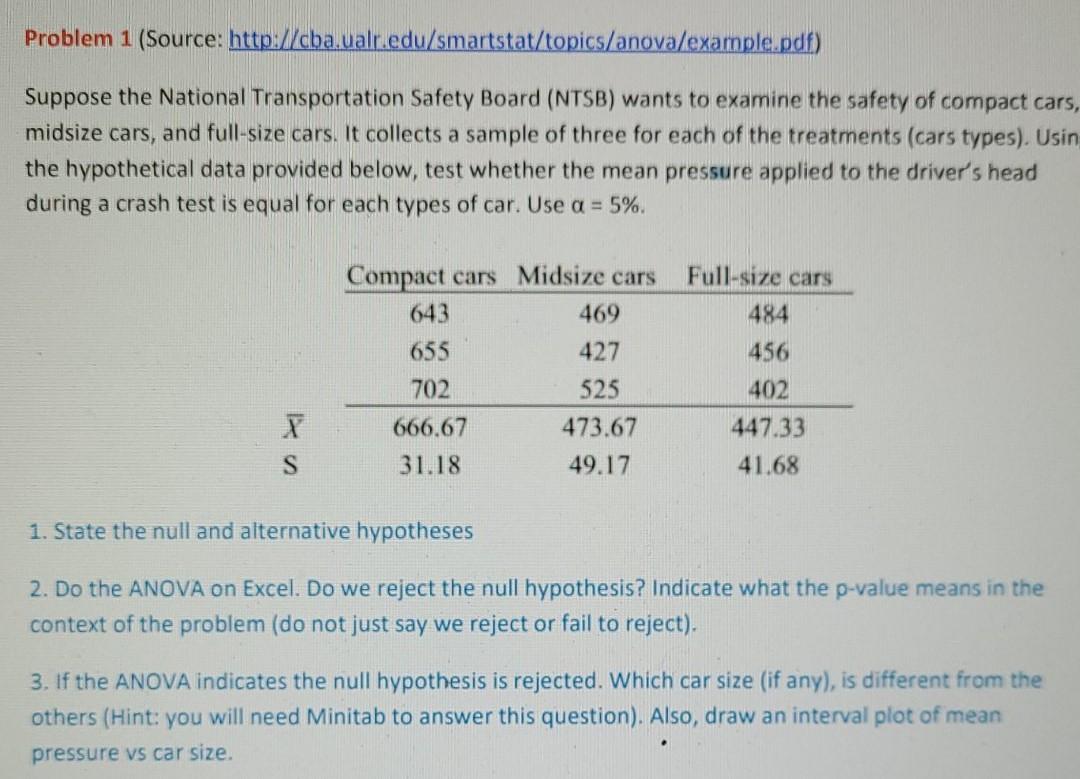
Problem 1 (Source: http://cba.ualr.edu/smartstat/topics/anova/example.pdf) Suppose the National Transportation Safety Board (NTSB) wants to examine the safety of compact cars, midsize cars, and full-size cars. It collects a sample of three for each of the treatments (cars types). Usin the hypothetical data provided below, test whether the mean pressure applied to the driver's head during a crash test is equal for each types of car. Use a = 5%. Full-size cars 484 456 Compact cars Midsize cars 643 469 655 427 702 525 666.67 473.67 31.18 49.17 402 447.33 41.68 S 1. State the null and alternative hypotheses 2. Do the ANOVA on Excel. Do we reject the null hypothesis? Indicate what the p-value means in the context of the problem (do not just say we reject or fail to reject). 3. If the ANOVA indicates the null hypothesis is rejected. Which car size (if any), is different from the others (Hint: you will need Minitab to answer this question). Also, draw an interval plot of mean pressure vs car sizeStep by Step Solution
There are 3 Steps involved in it
1 Expert Approved Answer
Step: 1 Unlock

Question Has Been Solved by an Expert!
Get step-by-step solutions from verified subject matter experts
Step: 2 Unlock
Step: 3 Unlock