

Question: Please provide step by step solution and explanation ou are a portfolio manager of a fund. Your firm's securities analysts have made the following forecasts
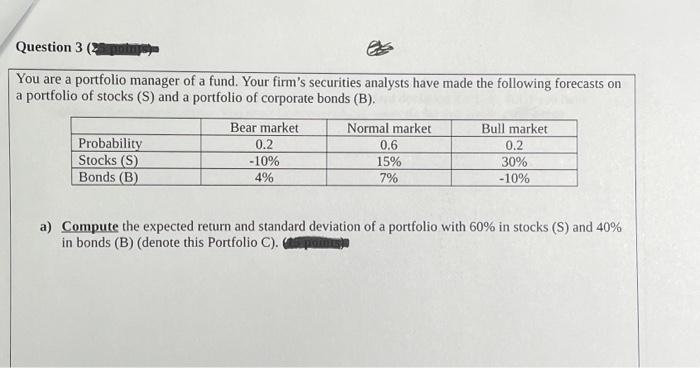
ou are a portfolio manager of a fund. Your firm's securities analysts have made the following forecasts on portfolio of stocks (S) and a portfolio of corporate bonds (B). a) Compute the expected return and standard deviation of a portfolio with 60% in stocks (S) and 40% in bonds (B) (denote this Portfolio C). b) Draw the efficient frontier and show Portfolio C, stocks (S), and bonds (B), in the graph, given all the information and computations (expected return and standard deviation for S, B, \& C) you have obtained from part a) above. You must label everything correctly for full credit wamme, c) Explain to your client, who is an individual investor, how his/her optimal risky portfolio is determined in this capital market where there are only these two risky assets, stocks and bonds, with the aid of a graph. (Note: A correct graph with all correct labels without explanation will earn xx points.) ou are a portfolio manager of a fund. Your firm's securities analysts have made the following forecasts on portfolio of stocks (S) and a portfolio of corporate bonds (B). a) Compute the expected return and standard deviation of a portfolio with 60% in stocks (S) and 40% in bonds (B) (denote this Portfolio C). b) Draw the efficient frontier and show Portfolio C, stocks (S), and bonds (B), in the graph, given all the information and computations (expected return and standard deviation for S, B, \& C) you have obtained from part a) above. You must label everything correctly for full credit wamme, c) Explain to your client, who is an individual investor, how his/her optimal risky portfolio is determined in this capital market where there are only these two risky assets, stocks and bonds, with the aid of a graph. (Note: A correct graph with all correct labels without explanation will earn xx points.)
Step by Step Solution
There are 3 Steps involved in it

Get step-by-step solutions from verified subject matter experts