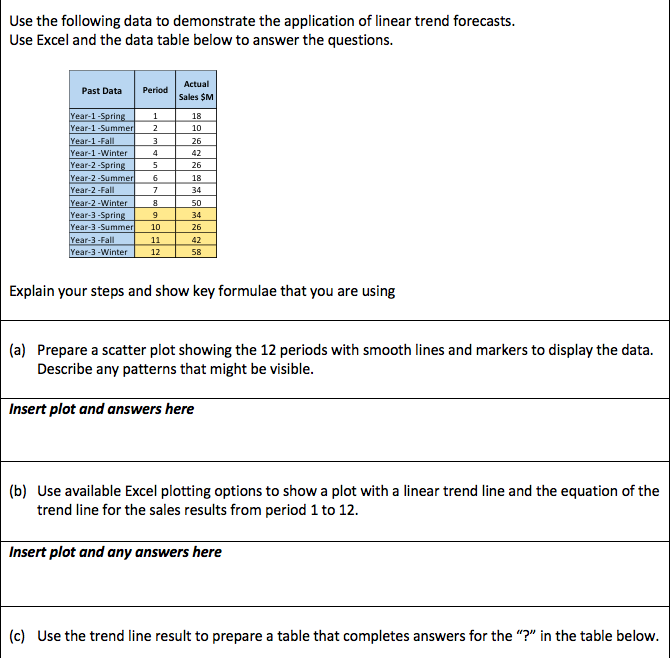
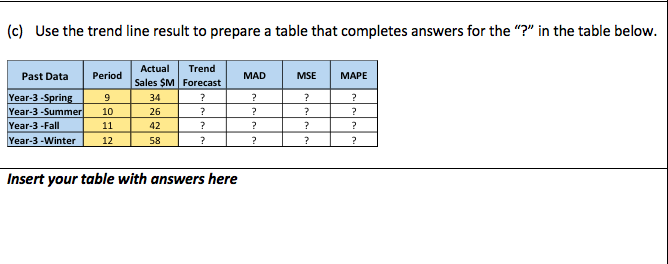
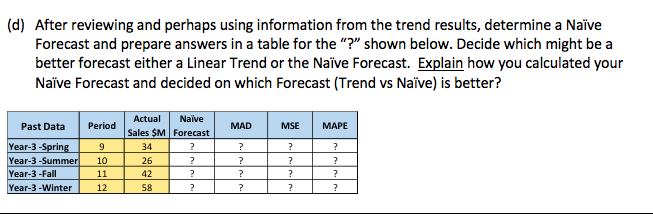
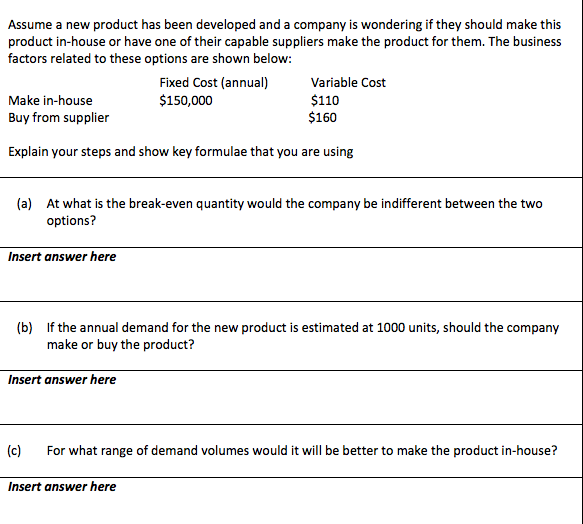
Question: ***PLEASE PROVIDE STEPS TO SOLVE EACH PART (INCLUDING EXCEL) Use the following data to demonstrate the application of linear trend forecasts. Use Excel and the

***PLEASE PROVIDE STEPS TO SOLVE EACH PART (INCLUDING EXCEL)

***PLEASE PROVIDE STEPS TO SOLVE EACH PART

***PLEASE PROVIDE STEPS TO SOLVE EACH PART

***PLEASE PROVIDE STEPS TO SOLVE EACH PART

***PLEASE PROVIDE STEPS TO SOLVE EACH PART

Use the following data to demonstrate the application of linear trend forecasts. Use Excel and the data table below to answer the questions. Past Data Period Actual Sales SM 1 2 3 4 5 Year-1-Spring Year-1 -Summer Year-1-Fall Year-1 - Winter Year-2-Spring Year-2 -Summer Year-2-Fall Year-2-Winter Year-3-Spring Year-3 -Summer Year-3-Fall Year-3 - Winter 6 7 8 9 18 10 26 42 26 18 34 50 34 26 42 58 10 11 12 Explain your steps and show key formulae that you are using (a) Prepare a scatter plot showing the 12 periods with smooth lines and markers to display the data. Describe any patterns that might be visible. Insert plot and answers here (b) Use available Excel plotting options to show a plot with a linear trend line and the equation of the trend line for the sales results from period 1 to 12. Insert plot and any answers here (c) Use the trend line result to prepare a table that completes answers for the "?" in the table below. (c) Use the trend line result to prepare a table that completes answers for the "?" in the table below. Period MAD MSE MAPE Past Data Year-3 - Spring Year-3 -Summerl Year-3-Fall Year-3 - Winter 9 10 11 12 Actual Trend Sales $M Forecast 34 ? 26 ? 42 ? 58 ? ? ? ? ? ? ? ? ? ? ? ? ? Insert your table with answers here (d) After reviewing and perhaps using information from the trend results, determine a Nave Forecast and prepare answers in a table for the "?" shown below. Decide which might be a better forecast either a Linear Trend or the Nave Forecast. Explain how you calculated your Nave Forecast and decided on which Forecast (Trend vs Nave) is better? Period MAD MSE MAPE Past Data Year-3-Spring Year-3-Summer Year-3-Fall Year-3-Winter Actual Naive Sales $M Forecast 34 ? 26 ? 42 ? 58 ? 9 10 11 12 ? ? ? ? ? ? ? ? ? ? ? Assume a new product has been developed and a company is wondering if they should make this product in-house or have one of their capable suppliers make the product for them. The business factors related to these options are shown below: Fixed Cost (annual) Variable Cost Make in-house $150,000 $110 Buy from supplier $160 Explain your steps and show key formulae that you are using (a) At what is the break-even quantity would the company be indifferent between the two options? Insert answer here (b) If the annual demand for the new product is estimated at 1000 units, should the company make or buy the product? Insert answer here (c) For what range of demand volumes would it will be better to make the product in-house? Insert answer here

Step by Step Solution

There are 3 Steps involved in it

1 Expert Approved Answer
Step: 1 Unlock blur-text-image
Question Has Been Solved by an Expert!

Get step-by-step solutions from verified subject matter experts

Step: 2 Unlock
Step: 3 Unlock

Students Have Also Explored These Related General Management Questions!