

Question: Please provide the answer based on the data given. I desperately gave a few dislikes for incorrect answers with different solutions already. Only answer if
Please provide the answer based on the data given. I desperately gave a few dislikes for incorrect answers with different solutions already.
Only answer if you can or at least as much as you know. Thank you
more information at https://www.chegg.com/homework-help/questions-and-answers/please-answer-questions-desperately-searched-chegg-solutions-wrong-incorrect-answers-provi-q86759723
or https://www.chegg.com/homework-help/questions-and-answers/please-answer-questions-desperately-searched-chegg-solutions-wrong-incorrect-answers-provi-q86759548
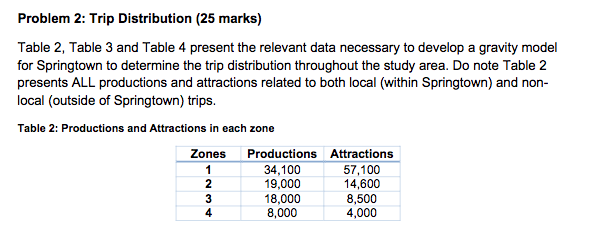
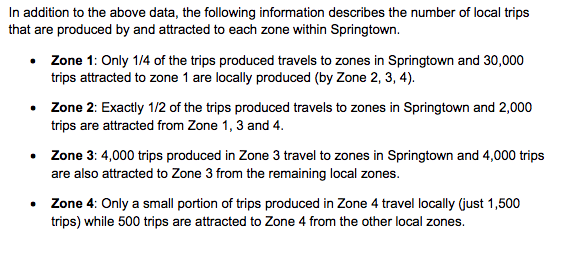
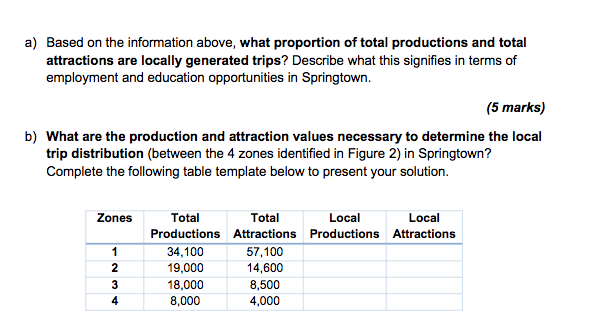
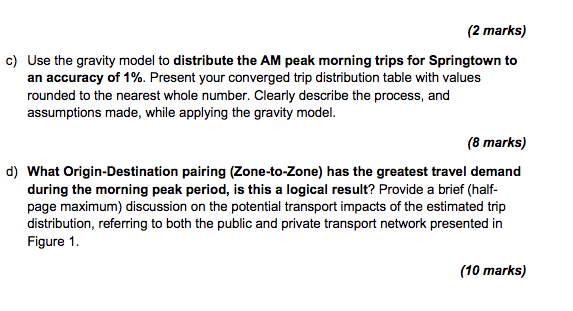
Problem 2: Trip Distribution (25 marks) Table 2, Table 3 and Table 4 present the relevant data necessary to develop a gravity model for Springtown to determine the trip distribution throughout the study area. Do note Table 2 presents ALL productions and attractions related to both local (within Springtown) and non- local (outside of Springtown) trips. Table 2: Productions and Attractions in each zone Zones Productions Attractions 1 34,100 57.100 19,000 14,600 18,000 8,500 8,000 4,000 2 3 4 In addition to the above data, the following information describes the number of local trips that are produced by and attracted to each zone within Springtown. Zone 1: Only 1/4 of the trips produced travels to zones in Springtown and 30,000 trips attracted to zone 1 are locally produced (by Zone 2, 3, 4). Zone 2: Exactly 1/2 of the trips produced travels to zones in Springtown and 2,000 trips are attracted from Zone 1, 3 and 4. Zone 3: 4,000 trips produced in Zone 3 travel to zones in Springtown and 4,000 trips are also attracted to Zone 3 from the remaining local zones. Zone 4: Only a small portion of trips produced in Zone 4 travel locally (just 1,500 trips) while 500 trips are attracted to Zone 4 from the other local zones. a) Based on the information above, what proportion of total productions and total attractions are locally generated trips? Describe what this signifies in terms of employment and education opportunities in Springtown. (5 marks) b) What are the production and attraction values necessary to determine the local trip distribution (between the 4 zones identified in Figure 2) in Springtown? Complete the following table template below to present your solution. Zones 1 2 3 4 Total Total Local Local Productions Attractions Productions Attractions 34,100 57,100 19,000 14,600 18,000 8,500 8,000 4,000 (2 marks) c) Use the gravity model to distribute the AM peak morning trips for Springtown to an accuracy of 1%. Present your converged trip distribution table with values rounded to the nearest whole number. Clearly describe the process, and assumptions made, while applying the gravity model. (8 marks) d) What Origin-Destination pairing (Zone-to-Zone) has the greatest travel demand during the morning peak period, is this a logical result? Provide a brief (half- page maximum) discussion on the potential transport impacts of the estimated trip distribution, referring to both the public and private transport network presented in Figure 1. (10 marks) Problem 2: Trip Distribution (25 marks) Table 2, Table 3 and Table 4 present the relevant data necessary to develop a gravity model for Springtown to determine the trip distribution throughout the study area. Do note Table 2 presents ALL productions and attractions related to both local (within Springtown) and non- local (outside of Springtown) trips. Table 2: Productions and Attractions in each zone Zones Productions Attractions 1 34,100 57.100 19,000 14,600 18,000 8,500 8,000 4,000 2 3 4 In addition to the above data, the following information describes the number of local trips that are produced by and attracted to each zone within Springtown. Zone 1: Only 1/4 of the trips produced travels to zones in Springtown and 30,000 trips attracted to zone 1 are locally produced (by Zone 2, 3, 4). Zone 2: Exactly 1/2 of the trips produced travels to zones in Springtown and 2,000 trips are attracted from Zone 1, 3 and 4. Zone 3: 4,000 trips produced in Zone 3 travel to zones in Springtown and 4,000 trips are also attracted to Zone 3 from the remaining local zones. Zone 4: Only a small portion of trips produced in Zone 4 travel locally (just 1,500 trips) while 500 trips are attracted to Zone 4 from the other local zones. a) Based on the information above, what proportion of total productions and total attractions are locally generated trips? Describe what this signifies in terms of employment and education opportunities in Springtown. (5 marks) b) What are the production and attraction values necessary to determine the local trip distribution (between the 4 zones identified in Figure 2) in Springtown? Complete the following table template below to present your solution. Zones 1 2 3 4 Total Total Local Local Productions Attractions Productions Attractions 34,100 57,100 19,000 14,600 18,000 8,500 8,000 4,000 (2 marks) c) Use the gravity model to distribute the AM peak morning trips for Springtown to an accuracy of 1%. Present your converged trip distribution table with values rounded to the nearest whole number. Clearly describe the process, and assumptions made, while applying the gravity model. (8 marks) d) What Origin-Destination pairing (Zone-to-Zone) has the greatest travel demand during the morning peak period, is this a logical result? Provide a brief (half- page maximum) discussion on the potential transport impacts of the estimated trip distribution, referring to both the public and private transport network presented in Figure 1. (10 marks)
Step by Step Solution
There are 3 Steps involved in it

Get step-by-step solutions from verified subject matter experts