

Question: Please provide the answer for the written portion and the Matlab code for the plot. We will use ODEs typical to epidemiological study. Specifically, we
 Please provide the answer for the written portion and the Matlab code for the plot.
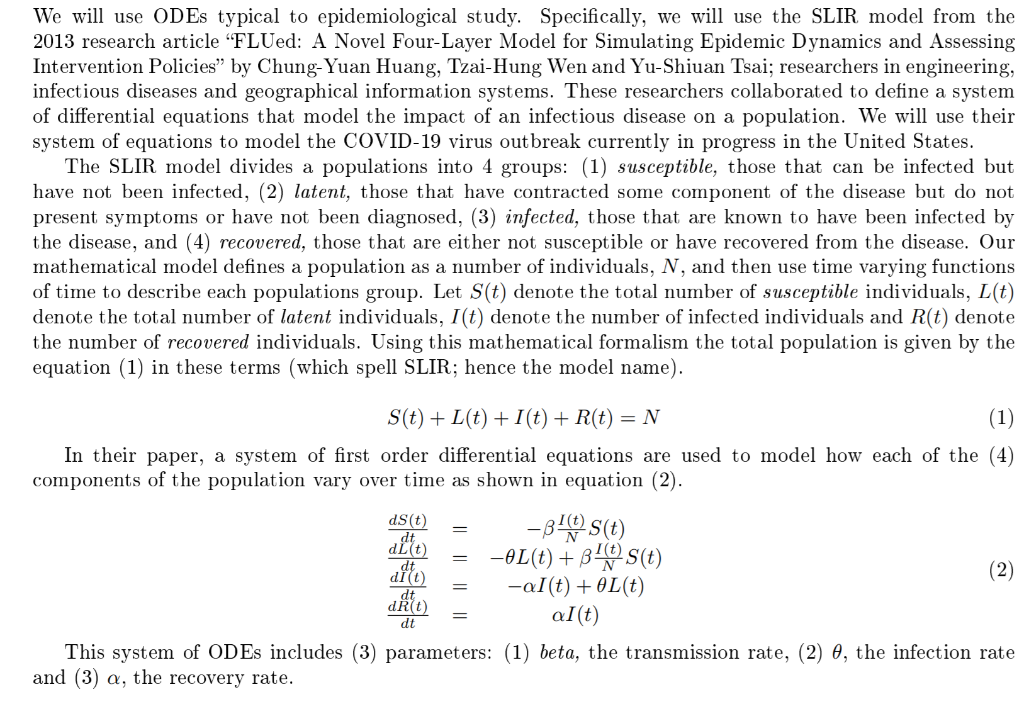
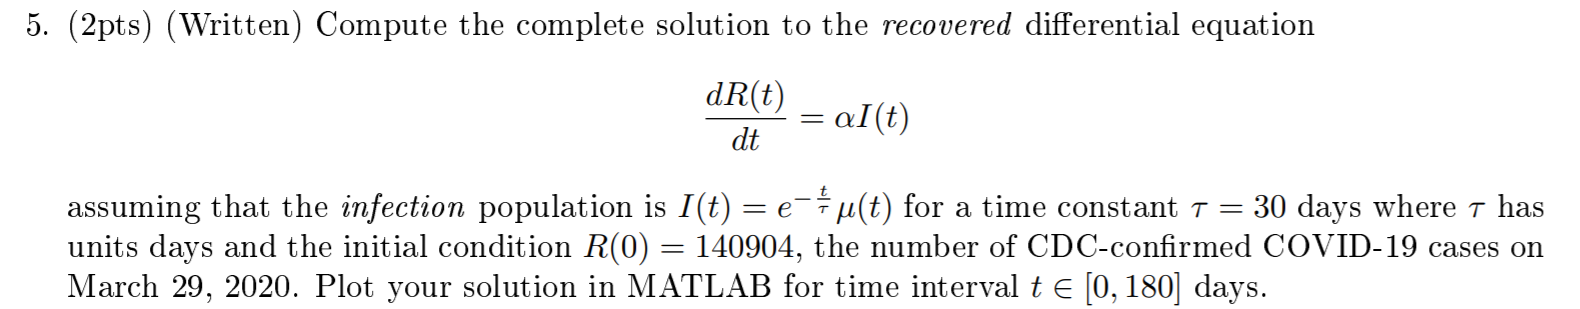
We will use ODEs typical to epidemiological study. Specifically, we will use the SLIR model from the 2013 research article "FLUed: A Novel Four-Layer Model for Simulating Epidemic Dynamics and Assessing Intervention Policies" by Chung-Yuan Huang, Tzai-Hung Wen and Yu-Shiuan Tsai; researchers in engineering, infectious diseases and geographical information systems. These researchers collaborated to define a system of differential equations that model the impact of an infectious disease on a population. We will use their system of equations to model the COVID-19 virus outbreak currently in progress in the United States. The SLIR model divides a populations into 4 groups: (1) susceptible, those that can be infected but have not been infected, (2) latent, those that have contracted some component of the disease but do not present symptoms or have not been diagnosed, (3) infected, those that are known to have been infected by the disease, and (4) recovered, those that are either not susceptible or have recovered from the disease. Our mathematical model defines a population as a number of individuals, N, and then use time varying functions of time to describe each populations group. Let S(t) denote the total number of susceptible individuals, L(t) denote the total number of latent individuals, I(t) denote the number of infected individuals and R(t) denote the number of recovered individuals. Using this mathematical formalism the total population is given by the equation (1) in these terms (which spell SLIR; hence the model name). S(t) + L(t)+1(t) + R(t) = N (1) In their paper, a system of first order differential equations are used to model how each of the (4) components of the population vary over time as shown in equation (2). ds(t) = -8 s(t) aitt) = -el(t)+31(4) S(t) alto (2) = -al(t) + OL(t) al(t) This system of ODEs includes (3) parameters: (1) beta, the transmission rate, (2) e, the infection rate and (3) a, the recovery rate. 5. (2pts) (Written) Compute the complete solution to the recovered differential equation dR(t) = al(t) dt assuming that the infection population is I(t) = e * u(t) for a time constant T = 30 days where t has units days and the initial condition R(0) = 140904, the number of CDC-confirmed COVID-19 cases on March 29, 2020. Plot your solution in MATLAB for time interval t E (0, 180) days. We will use ODEs typical to epidemiological study. Specifically, we will use the SLIR model from the 2013 research article "FLUed: A Novel Four-Layer Model for Simulating Epidemic Dynamics and Assessing Intervention Policies" by Chung-Yuan Huang, Tzai-Hung Wen and Yu-Shiuan Tsai; researchers in engineering, infectious diseases and geographical information systems. These researchers collaborated to define a system of differential equations that model the impact of an infectious disease on a population. We will use their system of equations to model the COVID-19 virus outbreak currently in progress in the United States. The SLIR model divides a populations into 4 groups: (1) susceptible, those that can be infected but have not been infected, (2) latent, those that have contracted some component of the disease but do not present symptoms or have not been diagnosed, (3) infected, those that are known to have been infected by the disease, and (4) recovered, those that are either not susceptible or have recovered from the disease. Our mathematical model defines a population as a number of individuals, N, and then use time varying functions of time to describe each populations group. Let S(t) denote the total number of susceptible individuals, L(t) denote the total number of latent individuals, I(t) denote the number of infected individuals and R(t) denote the number of recovered individuals. Using this mathematical formalism the total population is given by the equation (1) in these terms (which spell SLIR; hence the model name). S(t) + L(t)+1(t) + R(t) = N (1) In their paper, a system of first order differential equations are used to model how each of the (4) components of the population vary over time as shown in equation (2). ds(t) = -8 s(t) aitt) = -el(t)+31(4) S(t) alto (2) = -al(t) + OL(t) al(t) This system of ODEs includes (3) parameters: (1) beta, the transmission rate, (2) e, the infection rate and (3) a, the recovery rate. 5. (2pts) (Written) Compute the complete solution to the recovered differential equation dR(t) = al(t) dt assuming that the infection population is I(t) = e * u(t) for a time constant T = 30 days where t has units days and the initial condition R(0) = 140904, the number of CDC-confirmed COVID-19 cases on March 29, 2020. Plot your solution in MATLAB for time interval t E (0, 180) days
Step by Step Solution
There are 3 Steps involved in it

Get step-by-step solutions from verified subject matter experts