

Question: Please provide the code and the answers from the generated graphs. Important Note: wavread is no longer supported by MATLAB so please adjust with the
Please provide the code and the answers from the generated graphs.
Important Note: wavread is no longer supported by MATLAB so please adjust with the necessary new function
Links to Reference files for download:
tarzan.wav: https://instaud.io/29ky
Fiddle d.wav: https://instaud.io/29kz
001 a 003 ceg 2008 01 13 high: https://instaud.io/29kB
001 a 003 ceg 2008 01 13 low: https://instaud.io/29kA
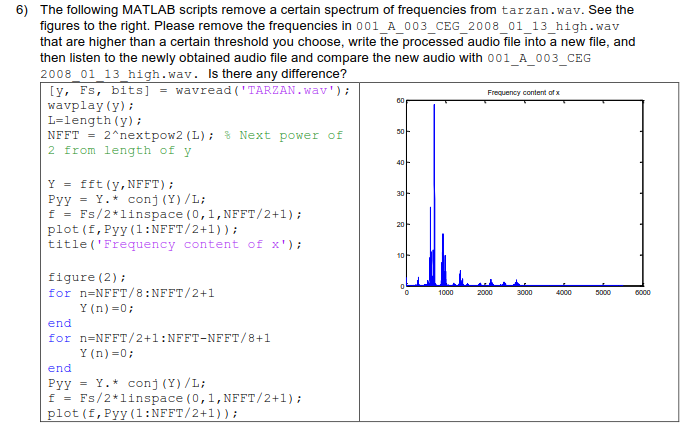
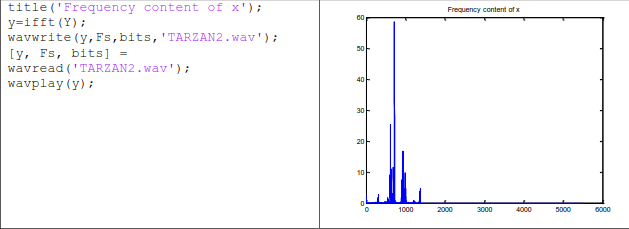
6) The following MATLAB scripts remove a certain spectrum of frequencies from tarzan.wav. See the figures to the right. Please remove the frequencies in 001_A_003_CEG_2008_01_13_high.wav that are higher than a certain threshold you choose, write the processed audio file into a new file, and then listen to the newly obtained audio file and compare the new audio with 001 A 003 CEG 2008 01 13 high.wav. Is there any difference? y, Fs, bits]wavread (TARZAN. wav); wavplay (y): L-length (y)i NFFT 2"nextpow2(L); % Next power of 2 from length of y Frequency content of x Y-fft (y,NEFT) Pyy -Y.* conj (Y)/L Fs/2 1inspace (0,1,NEFT/2+1) plot (f, Pyy (1:NFFT/2+1)) title ( Frequency content of x' figure (2); for n=NFFT/8:NFFT/2+1 Y (n)-0: end for n-NFFT/2+1: NFFT-NFFT/8+1 Y (n)-0: end Pyy -Y.* conj (Y)/L Fs/2 1inspace (0,1,NEFT/2+1) lot (f, Pyy(1:NFFT/2+1)); 6) The following MATLAB scripts remove a certain spectrum of frequencies from tarzan.wav. See the figures to the right. Please remove the frequencies in 001_A_003_CEG_2008_01_13_high.wav that are higher than a certain threshold you choose, write the processed audio file into a new file, and then listen to the newly obtained audio file and compare the new audio with 001 A 003 CEG 2008 01 13 high.wav. Is there any difference? y, Fs, bits]wavread (TARZAN. wav); wavplay (y): L-length (y)i NFFT 2"nextpow2(L); % Next power of 2 from length of y Frequency content of x Y-fft (y,NEFT) Pyy -Y.* conj (Y)/L Fs/2 1inspace (0,1,NEFT/2+1) plot (f, Pyy (1:NFFT/2+1)) title ( Frequency content of x' figure (2); for n=NFFT/8:NFFT/2+1 Y (n)-0: end for n-NFFT/2+1: NFFT-NFFT/8+1 Y (n)-0: end Pyy -Y.* conj (Y)/L Fs/2 1inspace (0,1,NEFT/2+1) lot (f, Pyy(1:NFFT/2+1))
Step by Step Solution
There are 3 Steps involved in it

Get step-by-step solutions from verified subject matter experts