

Question: Please provide the correct answer, no explanation needed. 4. Many small restaurants in Portland, Oregon, and other cities across the United States do not take


Please provide the correct answer, no explanation needed.
4.
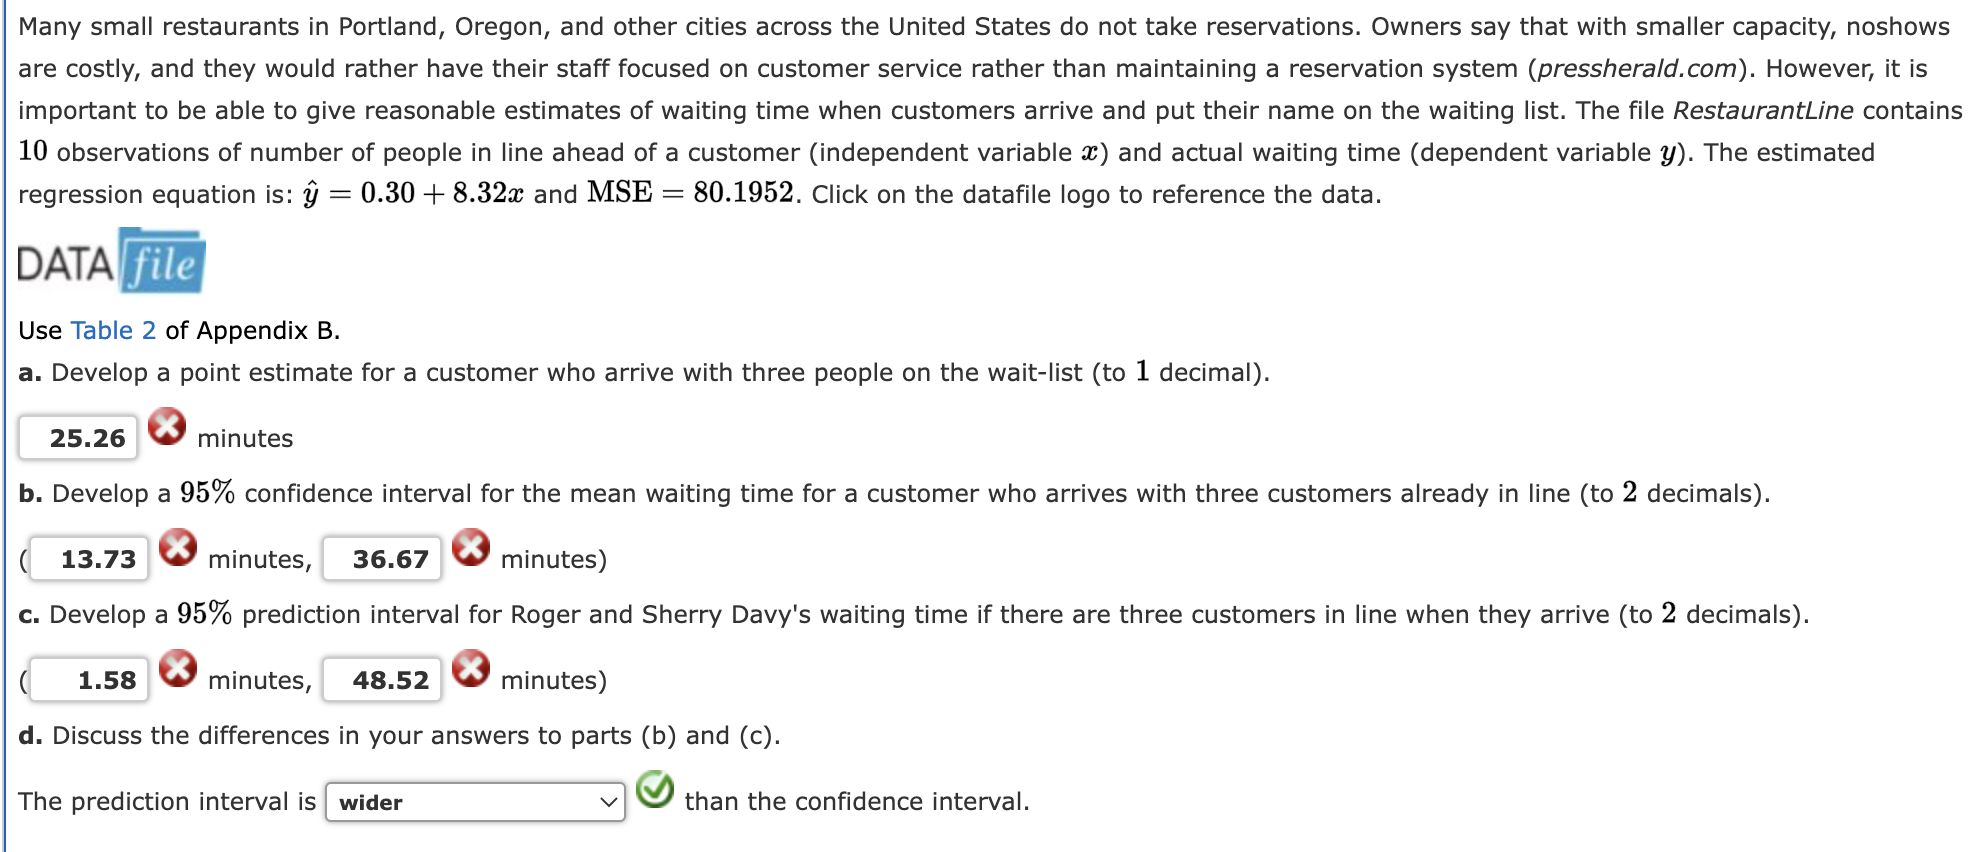
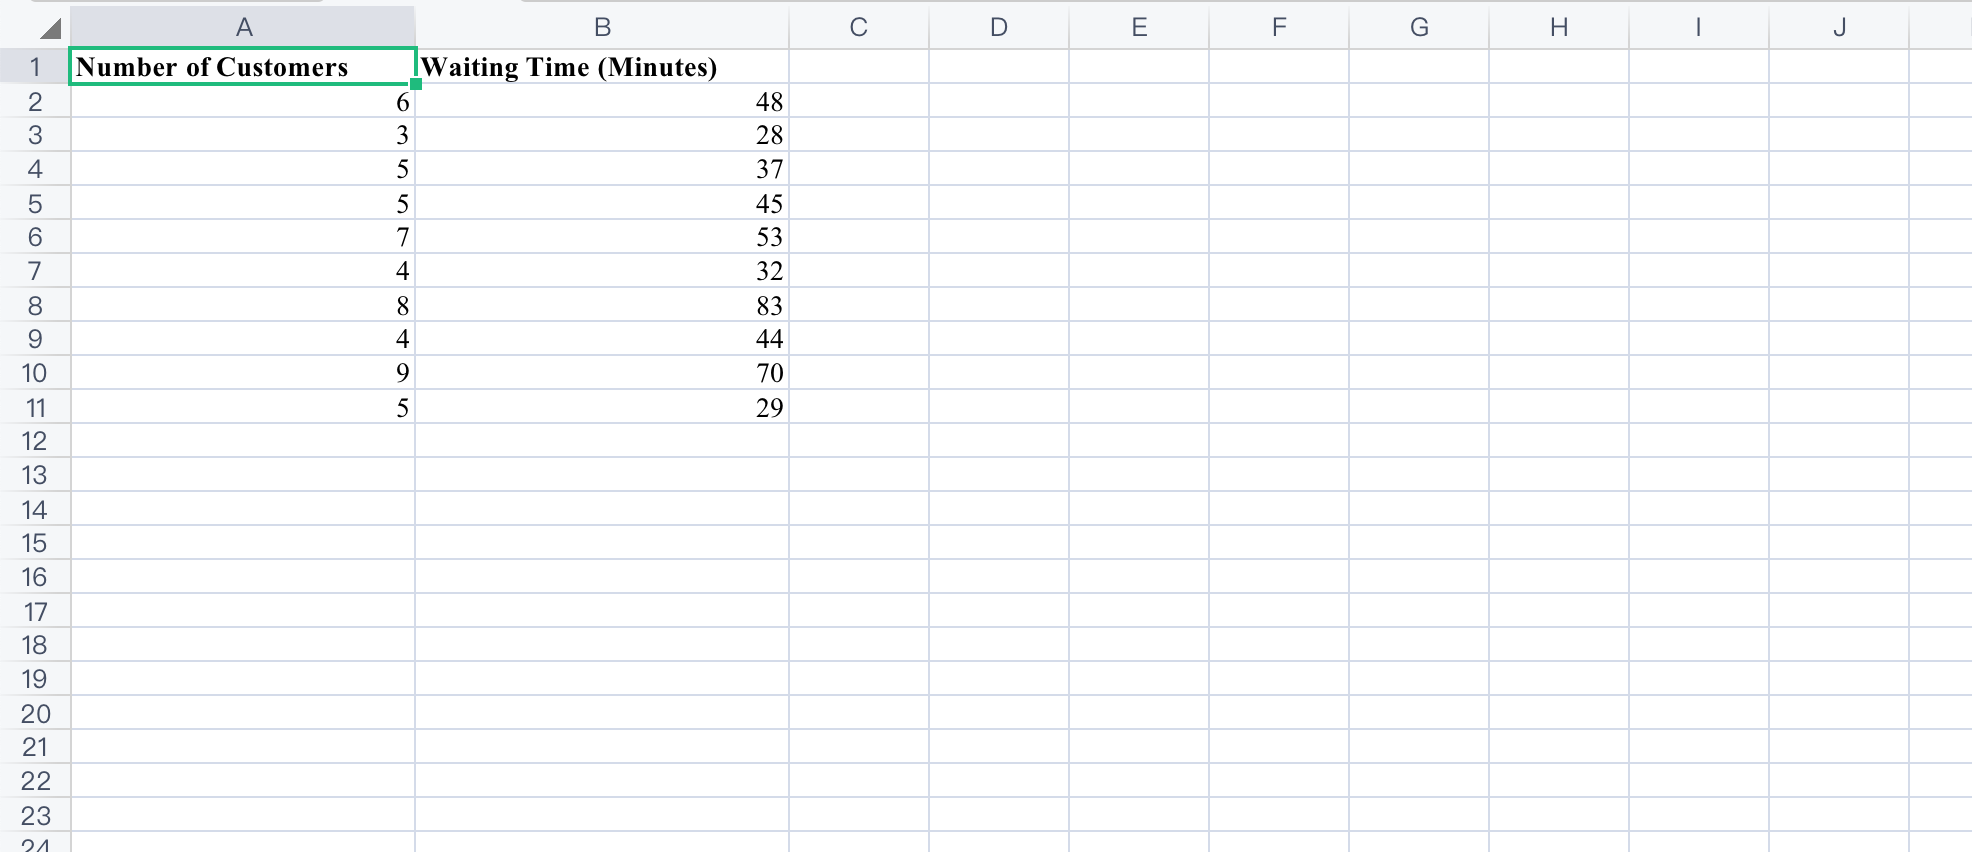
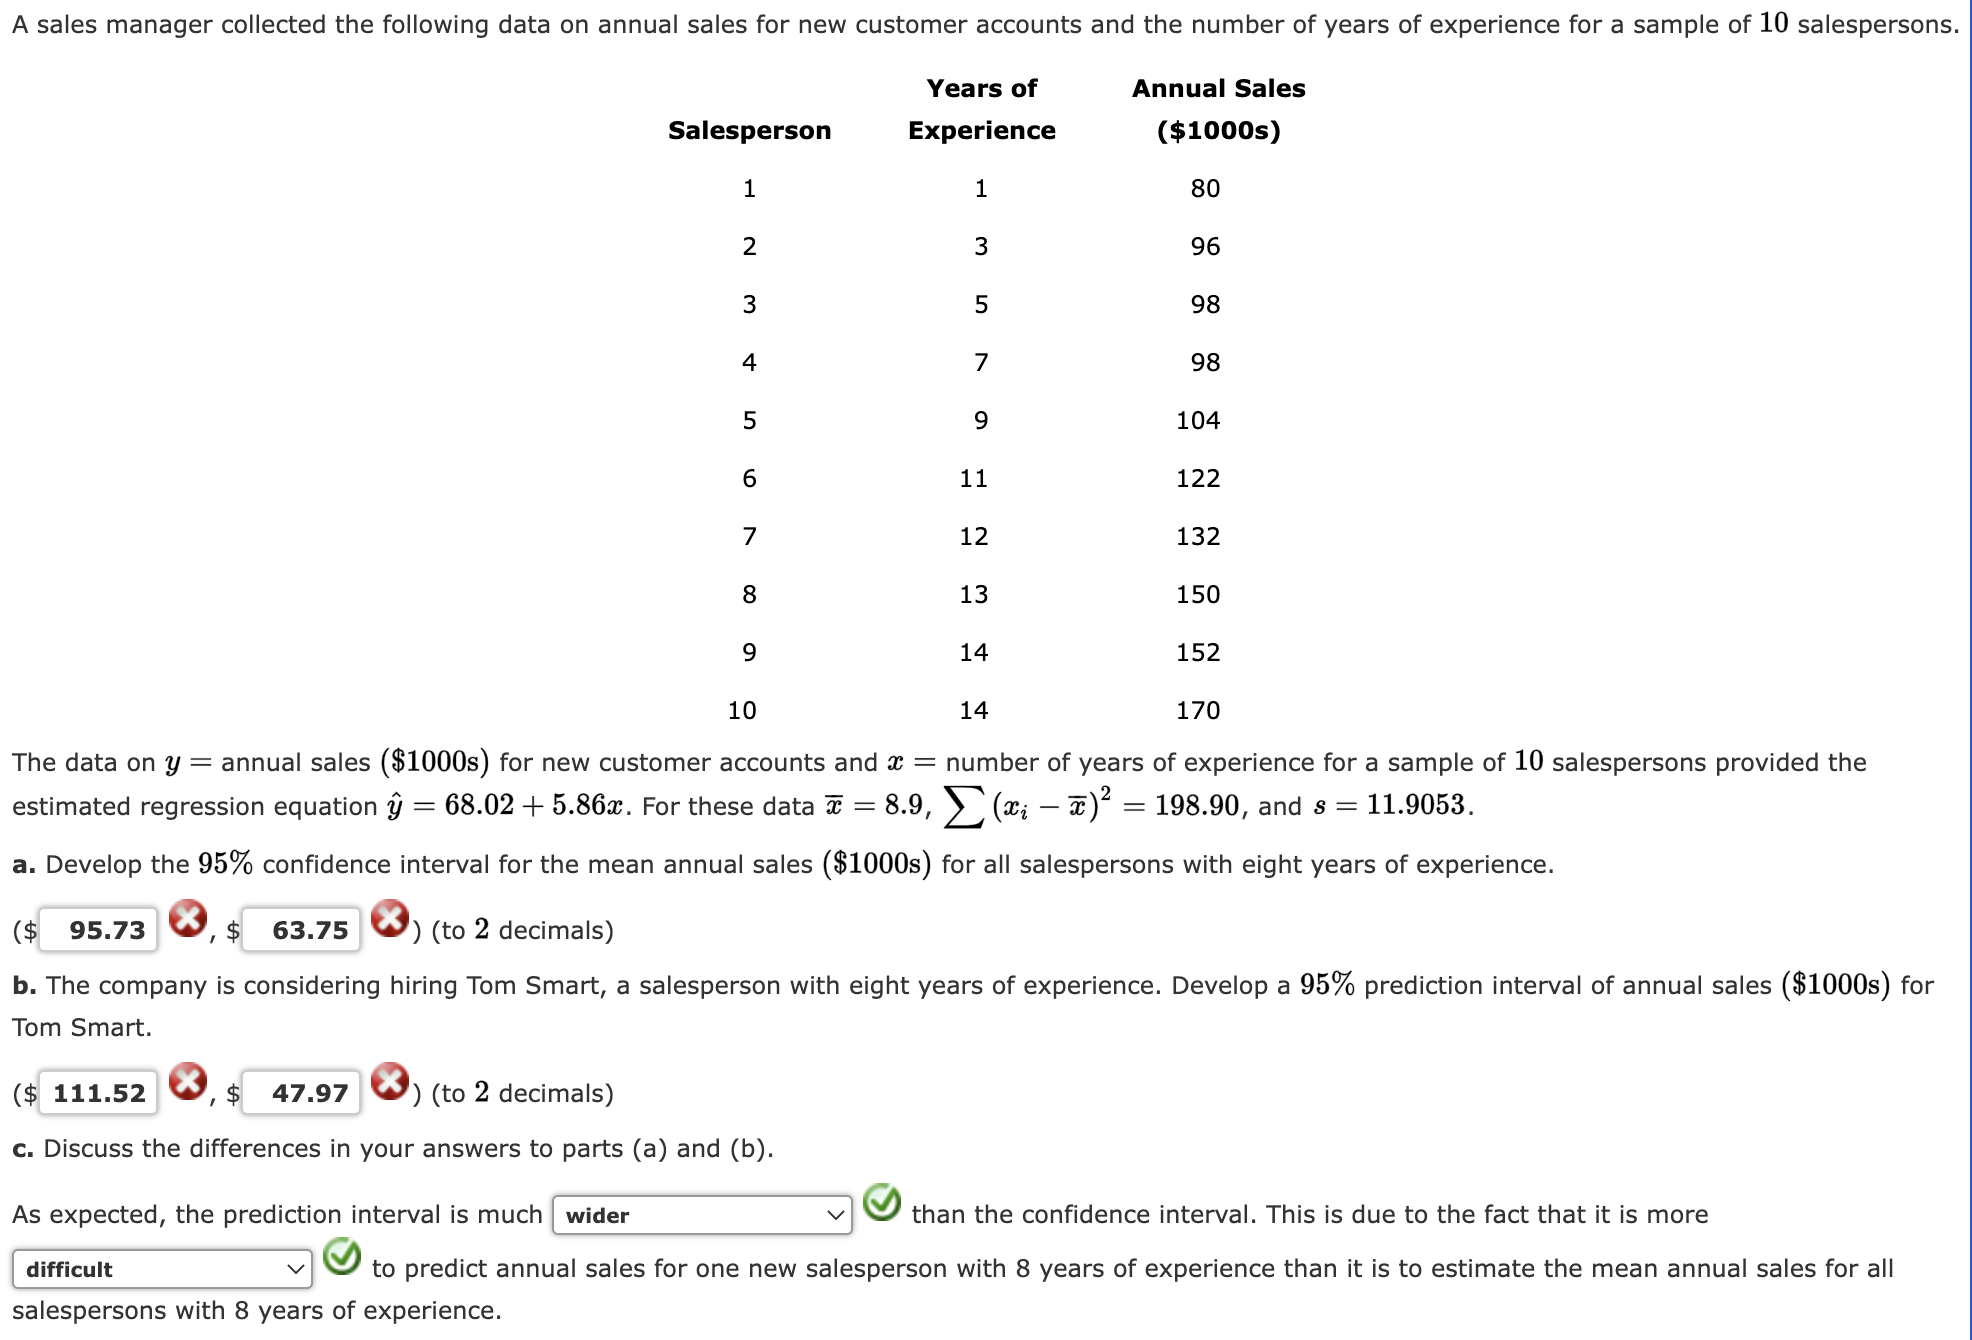


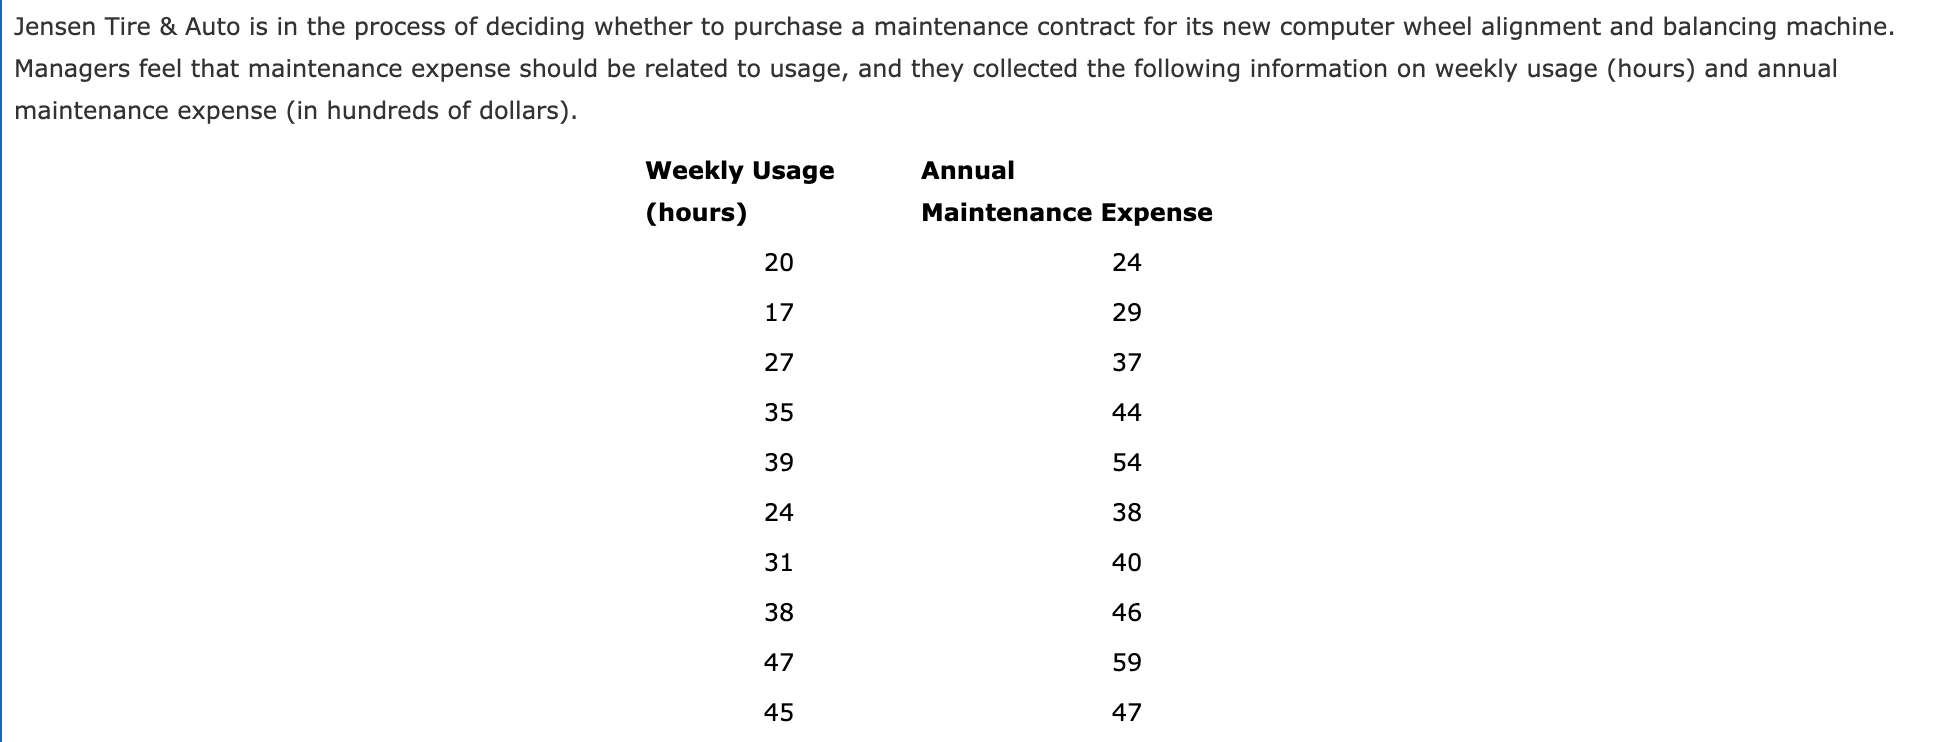
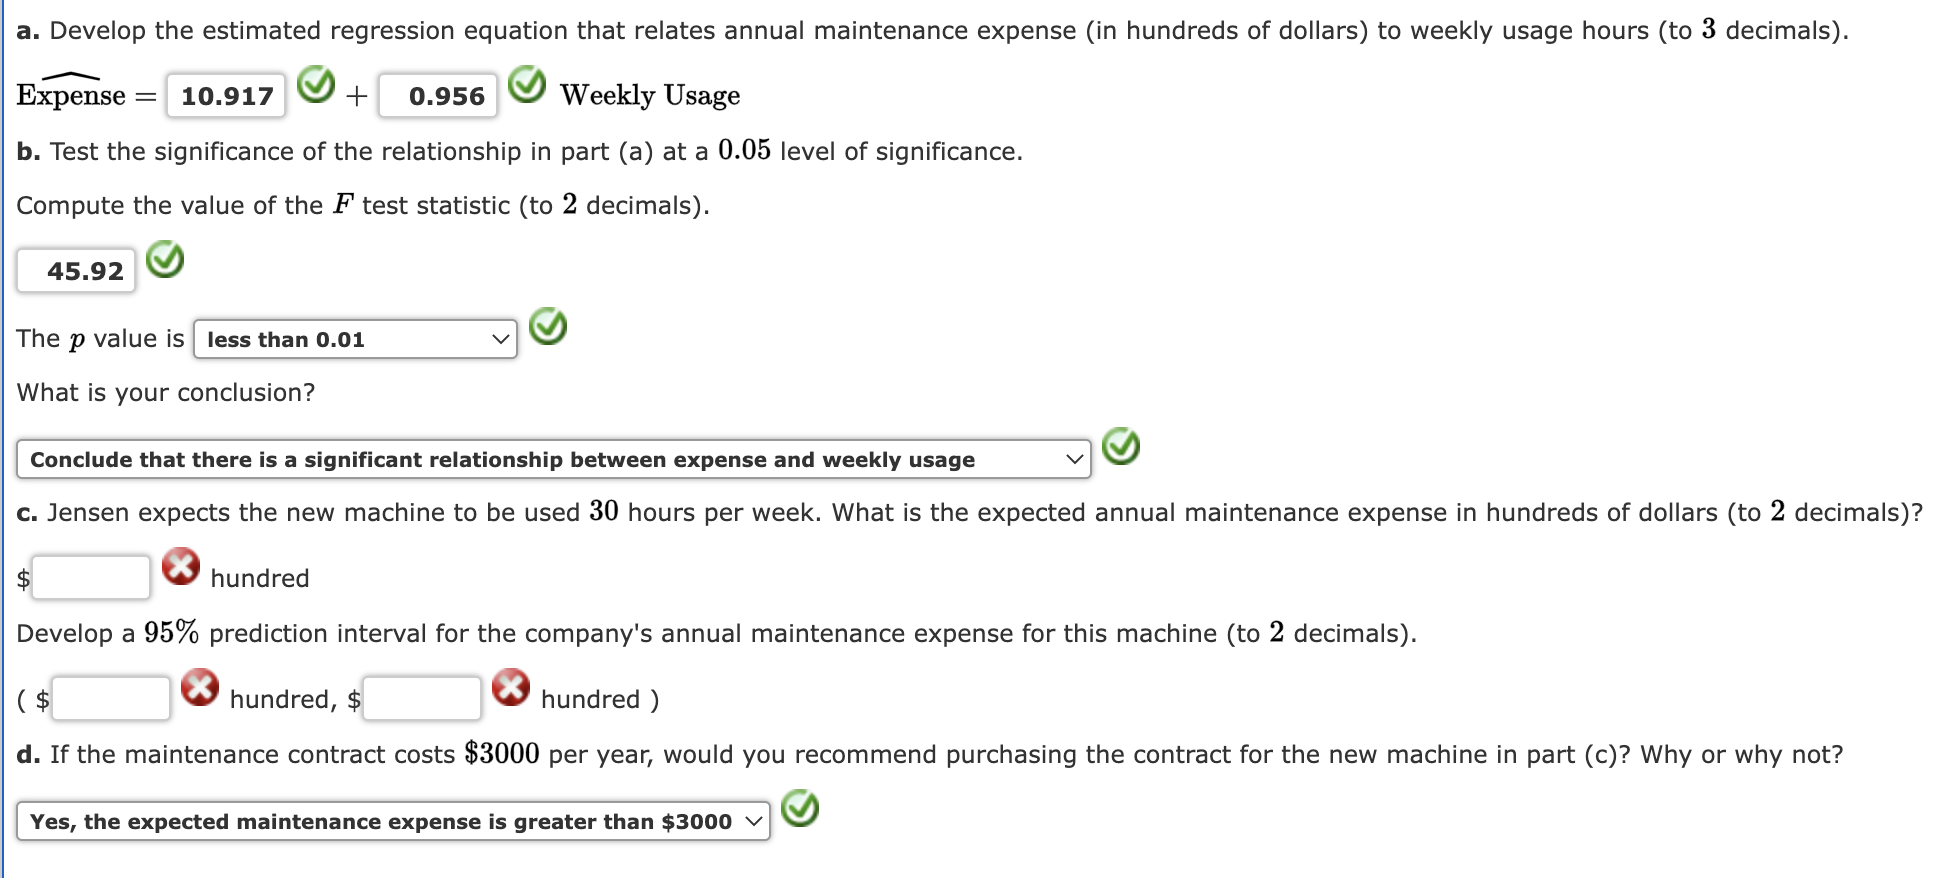
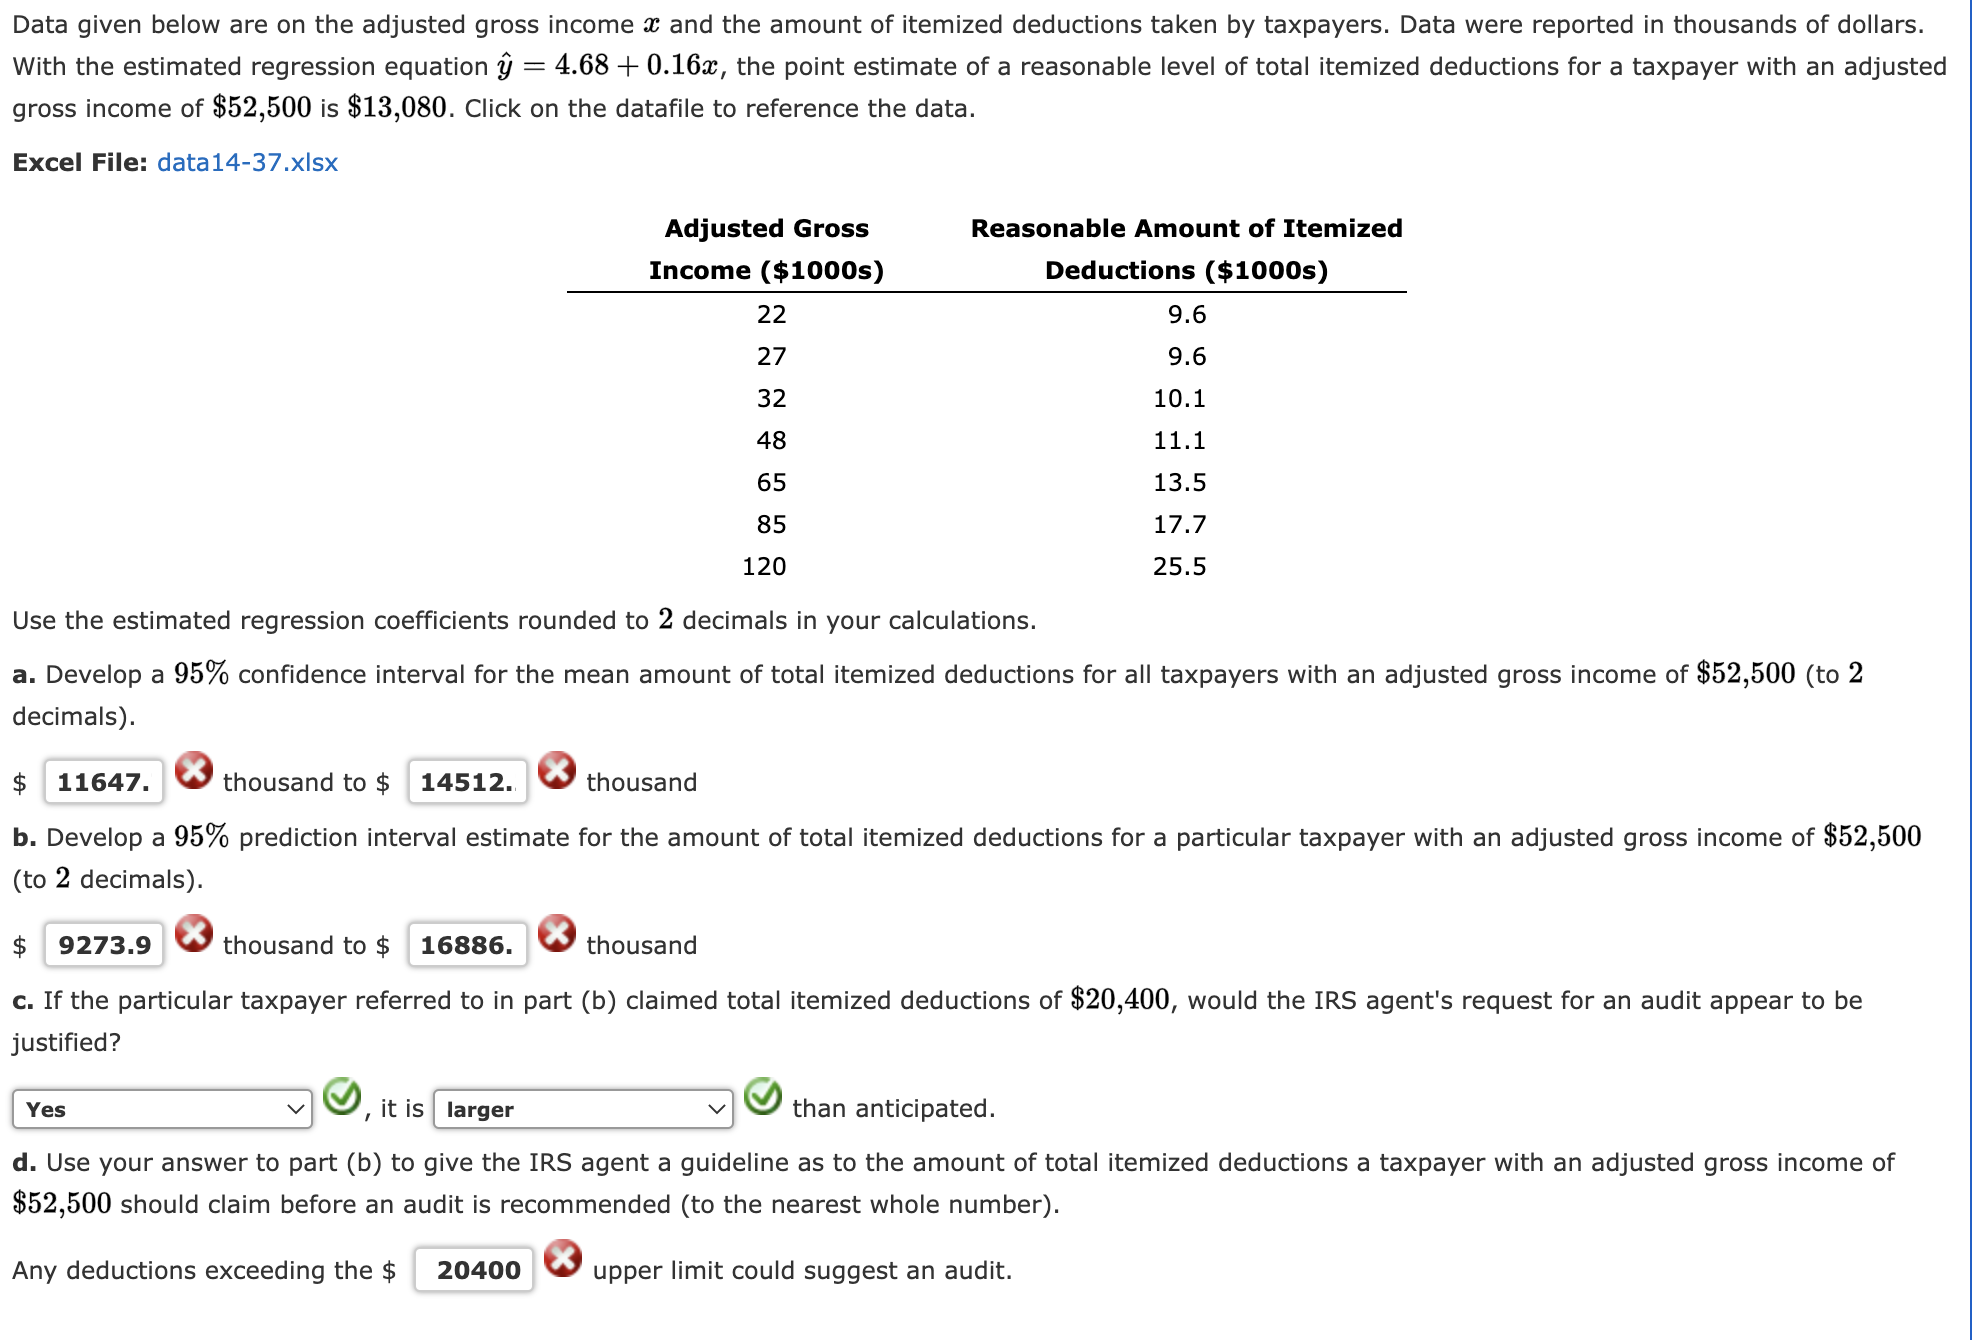
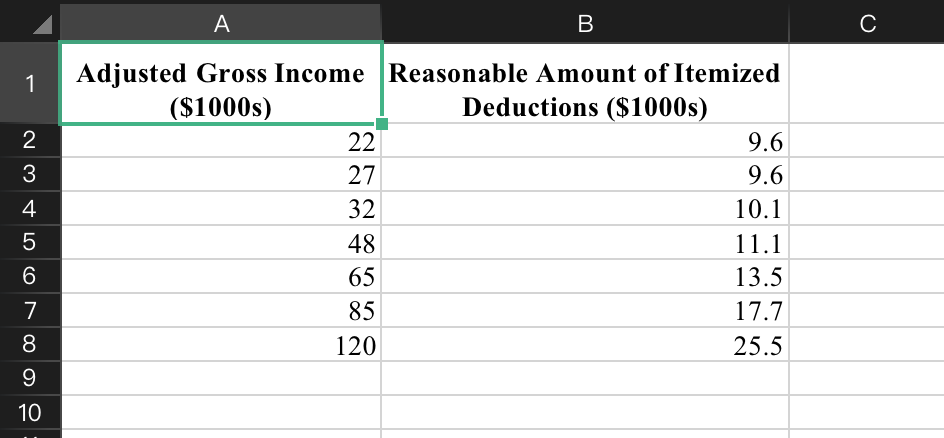
Many small restaurants in Portland, Oregon, and other cities across the United States do not take reservations. Owners say that with smaller capacity, noshows are costly, and they would rather have their staff focused on customer service rather than maintaining a reservation system (pressherald.com). However, it is important to be able to give reasonable estimates of waiting time when customers arrive and put their name on the waiting list. The file RestaurantLine contains 10 observations of number of people in line ahead of a customer (independent variable 11:) and actual waiting time (dependent variable y). The estimated regression equation is: (I) = 0.30 + 8.3232 and MSE = 80.1952. Click on the datafile logo to reference the data. DATAr Use Table 2 of Appendix B. 3. Develop a point estimate for a customer who arrive with three people on the wait-list (to 1 decimal). 25.26 0 minutes b. Develop a 95% confidence interval for the mean waiting time for a customer who arrives with three customers already in line (to 2 decimals). ( 13.73 0minutes, 36.67 0minutes) c. Develop a 95% prediction interval for Roger and Sherry Davy's waiting time if there are three customers in line when they arrive (to 2 decimals). ( 1.58 0minutes, 48.52 0minutes) d. Discuss the differences in your answers to parts (b) and (c). The prediction interval is Q0 than the condence interval. A B C D E F G H Number of Customers Waiting Time (Minutes) 48 W N 28 37 45 53 U D A DO A JULI WO 32 83 44 10 70 11 29 12 13 14 15 16 17 18 19 20 21 22 23A sales manager collected the following data on annual sales for new customer accounts and the number of years of experience for a sample of 10 salespersons. Years of Annual Sales Salesperson Experience ($10005) 1 1 80 2 3 96 3 5 98 4 7 98 5 9 104 6 11 122 7 12 132 8 13 150 9 14 152 10 14 170 The data on y = annual sales ($10003) for new customer accounts and m = number of years of experience for a sample of 10 salespersons provided the estimated regression equation = 68.02 + 5.86:}. For these data 5 = 8.9, 2(931- E)2 = 198.90, and s = 11.9053. 3. Develop the 95% confidence interval for the mean annual sales ($1000s) for all salespersons with eight years of experience. ($ 95.73 0, $ 63.75 0) (toZ decimals) b. The company is considering hiring Tom Smart, a salesperson with eight years of experience. Develop a 95% prediction interval of annual sales ($10008) for Tom Smart. ($ 111.52 0, $ 47.97 0) (to 2 decimals) c. Discuss the differences in your answers to parts (a) and (b). As expected, the prediction interval is much \\'9 than the confidence interval. This is due to the fact that it is more K'o to predict annual sales for one new salesperson with 8 years of experience than it is to estimate the mean annual sales for all salespersons with 8 years of experience. Data given below are on the adjusted gross income a: and the amount of itemized deductions taken by taxpayers. Data were reported in thousands of dollars. With the estimated regression equation 3,7 = 4.68 + 0.1692, the point estimate of a reasonable level of total itemized deductions for a taxpayer with an adjusted gross income of $52,500 is $13,080. Click on the datafile to reference the data. Excel File: data 1437.x|sx Adjusted Gross Reasonable Amount of Itemized Income ($1000s) Deductions ($10005) 22 9.6 27 9.6 32 10.1 48 11.1 65 13.5 85 17.7 120 25.5 Use the estimated regression coefficients rounded to 2 decimals in your calculations. 3. Develop a 95% confidence interval for the mean amount of total itemized deductions for all taxpayers with an adjusted gross income of $52,500 (to 2 decimals). $ 11647. 0 thousand to $ 14512. 0 thousand b. Develop a 95% prediction interval estimate for the amount of total itemized deductions for a particular taxpayer with an adjusted gross income of $52,500 (to 2 decimals). :1; 9273.9 0 thousand to $ 16886. 0 thousand c. If the particular taxpayer referred to in part (b) claimed total itemized deductions of $20,400, would the IRS agent's request for an audit appear to be justified? d. Use your answer to part (b) to give the IRS agent a guideline as to the amount of total itemized deductions a taxpayer with an adjusted gross income of $52,500 should claim before an audit is recommended (to the nearest whole number). Any deductions exceeding the $ 20400 0 upper limit could suggest an audit. \fJensen Tire & Auto is in the process of deciding whether to purchase a maintenance contract for its new computer wheel alignment and balancing machine. Managers feel that maintenance expense should be related to usage, and they collected the following information on weekly usage (hours) and annual maintenance expense (in hundreds of dollars). Weekly Usage Annual (hours) Maintenance Expense 20 24 17 29 27 37 35 44 39 54 24 38 31 40 38 46 47 59 45 47 a. Develop the estimated regression equation that relates annual maintenance expense (in hundreds of dollars) to weekly usage hours (to 3 decimals). Expense: 10.917 9+ 0.956 K20 WeeklyUsage b. Test the significance of the relationship in part (a) at a 0.05 level of significance. Compute the value of the F test statistic (to 2 decimals). 45.92 9 Wetw What is your conclusion? ' Conclude that there is a significant relationship between expense and weekly usage V, M c. Jensen expects the new machine to be used 30 hours per week. What is the expected annual maintenance expense in hundreds of dollars (to 2 decimals)? $ 0 hundred Develop a 95% prediction interval for the company's annual maintenance expense for this machine (to 2 decimals). ($ 0 hundred, $ 0 hundred ) d. If the maintenance contract costs $3000 per year, would you recommend purchasing the contract for the new machine in part (c)? Why or why not? ' Yes, the expected maintenance expense is greater than $3000 V] Q0
Step by Step Solution
There are 3 Steps involved in it

Get step-by-step solutions from verified subject matter experts