

Question: PLEASE provide the excel workbook as well You will be using excel and word to answer this question .Upload both your word and excel documents.
PLEASE provide the excel workbook as well
You will be using excel and word to answer this question.Upload both your word and excel documents.
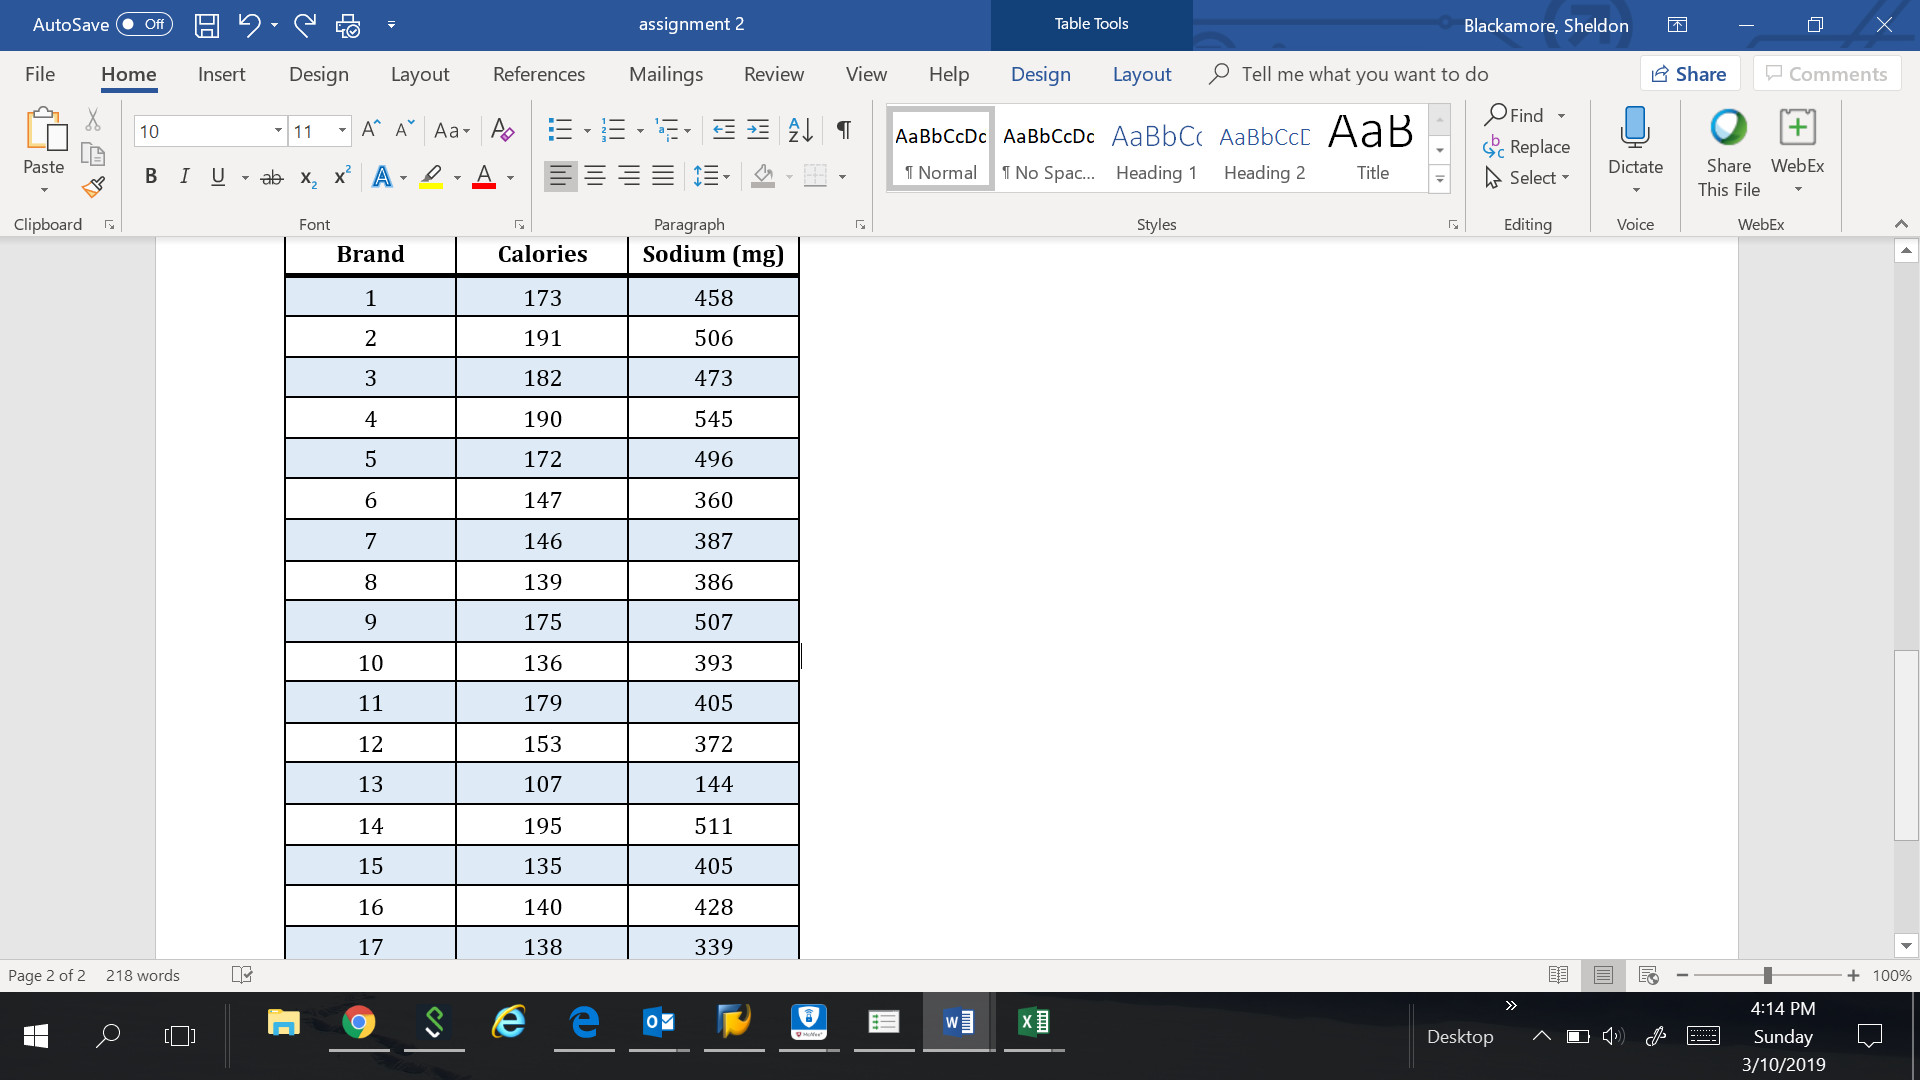
The data set shown below gives the calories and salt content in 17 brands of meat hot dogs.
1.Enter the data set into excel.Using excel perform a least squares regression on the data set.Use Sodium as the y variable and Calories as the x variable.Make a scatter plot with the regression line plotted as well.Using excel compute the correlation coefficient.
2.Insert the plot your created into a word document.Discuss the scatter plot and regression line.Are their outliers?Does your correlation coefficient support your analysis?Does it tell you anything else?
3.If there is an outlier remove the outlier from the data set and repeat the previous two parts.
4.Can you conclude that hot dogs with more calories will have more sodium (i.e. discuss correlation and causation)
ACTTO STEVE O OLD) {}EdKELLOGG, SHE``` File Home Insert Design Layout\\ References Mailings* Review View Help Design Layout\\ O Tell me what you want to do 12} Share| ~ Comments* 70 | 11 -| A" A" Ha -| PO O Find - Q + Paste LAA AaBbCCDC AaBbCCDC AaBbC( AaBbCc[ Hab Gc Replace B I U - ab Xx X}| A - D - A -` IT Normal IT NO Spac ..\\ Heading 1 Heading 2\\ Title At Select * Dictate Share WebEx & This File* Clipboard\\ Font Paragraph Styles Editing Voice WebEx Brand Calories Sodium ( Ing ) 1 173 458 2 191 506 3 182 473 4 190 545 5 172 496 6 147 360 7 146 387 8 139 386 9 175 507 10 136 393 11 179 405 12 153 372 13 107 144 14 195 51 1 15 135 405 16 140 428 17 138 339 Page 2 of 2 218 words EE| || EQ + 100 % ON WE DEs``
Step by Step Solution
There are 3 Steps involved in it

Get step-by-step solutions from verified subject matter experts