

Question: Please provide the formulas required to satisfy each empty yellow box not just the answers, Thank You ! CM D 11 fx A B D
Please provide the formulas required to satisfy each empty yellow box not just the answers, Thank You !
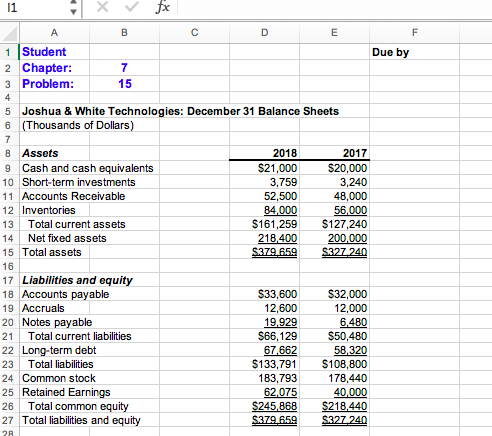
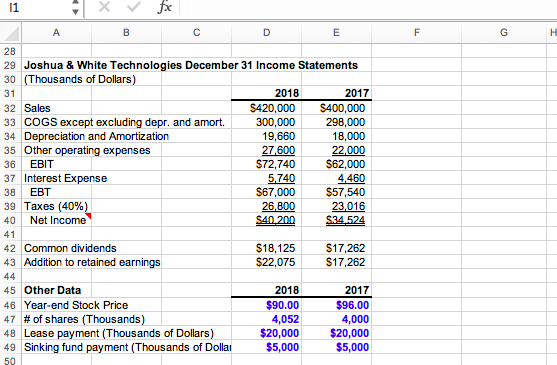
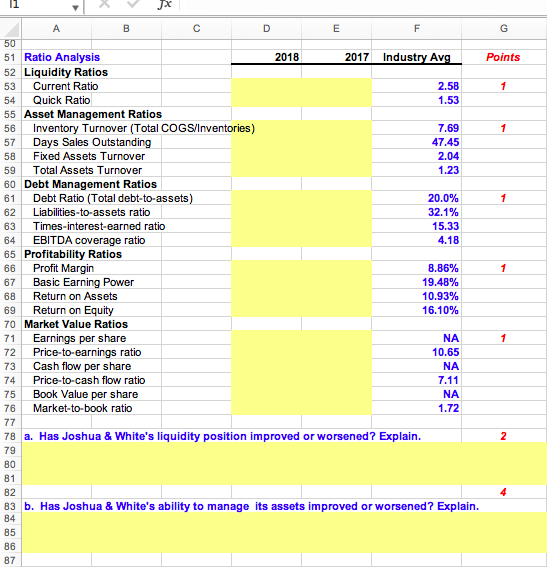
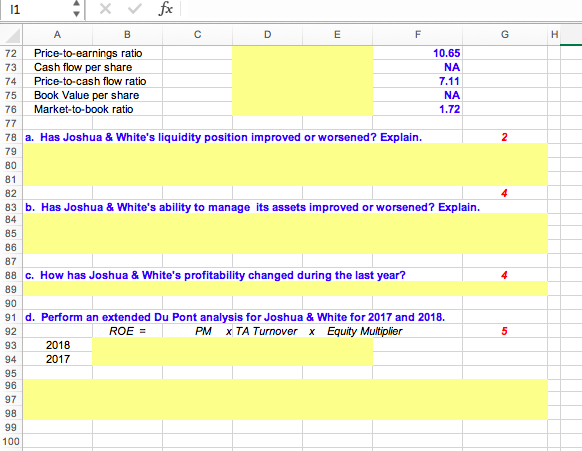
CM D 11 fx A B D E F 1 Student Due by 2 Chapter: 7 3 Problem: 15 4 5 Joshua & White Technologies: December 31 Balance Sheets 6 (Thousands of Dollars) 7 8 Assets 2018 2017 9 Cash and cash equivalents $21,000 $20,000 10 Short-term investments 3,759 3,240 11 Accounts Receivable 52,500 48,000 12 Inventories 84,000 56,000 13 Total current assets $161,259 $127.240 14 Net fixed assets 218,400 200,000 15 Total assets $379,659 $327.240 16 17 Liabilities and equity 18 Accounts payable $33,600 $32,000 19 Accruals 12,600 12,000 20 Notes payable 19,929 6,480 21 Total current liabilities $66,129 $50,480 22 Long-term debt 67,662 58,320 23 Total liabilities $133,791 $108,800 24 Common stock 183,793 178,440 25 Retained Earnings 62,075 40,000 26 Total common equity $245,868 $218.440 27 Total liabilities and equity $379.659 $327 240 28 11 fx A B E F G 28 29 Joshua & White Technologies December 31 Income Statements 30 (Thousands of Dollars) 31 2018 2017 32 Sales $420,000 $400,000 33 COGS except excluding depr. and amort. 300,000 298,000 34 Depreciation and Amortization 19,660 18,000 35 Other operating expenses 27,600 22.000 36 EBIT $72,740 $62,000 37 Interest Expense 5,740 4,460 38 EBT $67,000 $57,540 39 Taxes (40%) 26,800 23,016 40 Net Income $40.200 $34.524 41 42 Common dividends $18,125 $17,262 43 Addition to retained earnings $22,075 $17,262 44 45 Other Data 2018 2017 46 Year-end Stock Price $90.00 $96.00 47 # of shares (Thousands) 4,052 4,000 48 Lease payment (Thousands of Dollars) $20,000 $20,000 49 Sinking fund payment (Thousands of Dollar $5,000 $5,000 50 Jx A c 54 1 B E F 50 51 Ratio Analysis 2018 2017 Industry Avg Points 52 Liquidity Ratios 53 Current Ratio 2.58 1 Quick Ratio 1.53 55 Asset Management Ratios 56 Inventory Turnover (Total COGS/Inventories) 7.69 1 57 Days Sales Outstanding 47.45 58 Fixed Assets Turnover 2.04 59 Total Assets Turnover 1.23 60 Debt Management Ratios 61 Debt Ratio (Total debt-to-assets) 20.0% 1 62 Liabilities-to-assets ratio 32.1% 63 Times-interest-earned ratio 15.33 64 EBITDA coverage ratio 4.18 65 Profitability Ratios 66 Profit Margin 8.86% 67 Basic Earning Power 19.48% 68 Return on Assets 10.93% 69 Return on Equity 16.10% 70 Market Value Ratios 71 Earnings per share NA 1 72 Price-to-earnings ratio 10.65 73 Cash flow per share NA 74 Price-to-cash flow ratio 7.11 75 Book Value per share NA 76 Market-to-book ratio 1.72 77 78 a. Has Joshua & White's liquidity position improved or worsened? Explain. 79 80 81 82 83 b. Has Joshua & White's ability to manage its assets improved or worsened? Explain. 84 85 86 87 2 11 fx D E F G H 72 73 74 75 76 77 A B Price-to-earnings ratio Cash flow per share Price-to-cash flow ratio Book Value per share Market-to-book ratio 10.65 NA 7.11 NA 1.72 78 a. Has Joshua & White's liquidity position improved or worsened? Explain. 2 79 80 81 82 83 b. Has Joshua & White's ability to manage its assets improved or worsened? Explain. 84 85 86 87 88 C. How has Joshua & White's profitability changed during the last year? 89 90 91 d. Perform an extended Du Pont analysis for Joshua & White for 2017 and 2018. 92 ROE = PM X TA Turnover x Equity Multiplier 93 2018 94 2017 5 95 96 97 98 99 100
Step by Step Solution
There are 3 Steps involved in it

Get step-by-step solutions from verified subject matter experts