

Question: Please provide the formulas used as per to excel functions Question 3 - Wind and Solar Power The sheet named Wind and Solar contains data
Please provide the formulas used as per to excel functions
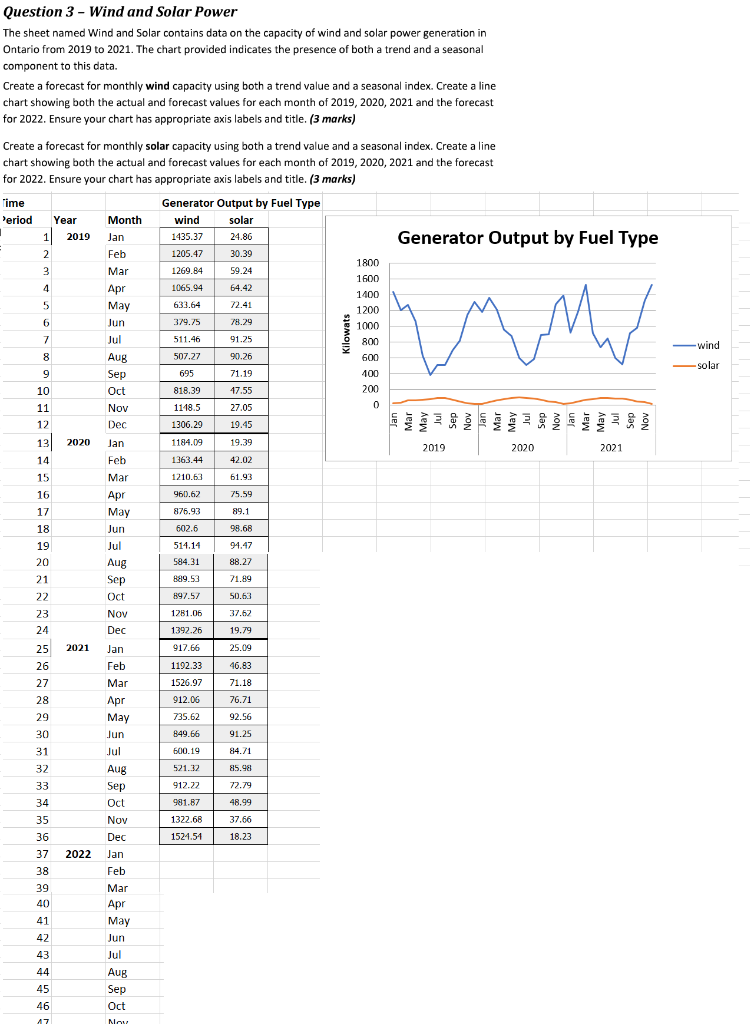
Question 3 - Wind and Solar Power The sheet named Wind and Solar contains data on the capacity of wind and solar power generation in Ontario from 2019 to 2021. The chart provided indicates the presence of both a trend and a seasonal component to this data. Create a forecast for monthly wind capacity using both a trend value and a seasonal index. Create a line chart showing both the actual and forecast values for each month of 2019, 2020, 2021 and the forecast for 2022. Ensure your chart has appropriate axis labels and title. (3 marks) Create a forecast for monthly solar capacity using both a trend value and a seasonal index. Create a line chart showing both the actual and forecast values for each month of 2019, 2020, 2021 and the forecast for 2022. Ensure your chart has appropriate axis labels and title. (3 marks) Question 3 - Wind and Solar Power The sheet named Wind and Solar contains data on the capacity of wind and solar power generation in Ontario from 2019 to 2021. The chart provided indicates the presence of both a trend and a seasonal component to this data. Create a forecast for monthly wind capacity using both a trend value and a seasonal index. Create a line chart showing both the actual and forecast values for each month of 2019, 2020, 2021 and the forecast for 2022. Ensure your chart has appropriate axis labels and title. (3 marks) Create a forecast for monthly solar capacity using both a trend value and a seasonal index. Create a line chart showing both the actual and forecast values for each month of 2019, 2020, 2021 and the forecast for 2022. Ensure your chart has appropriate axis labels and title
Step by Step Solution
There are 3 Steps involved in it

Get step-by-step solutions from verified subject matter experts