

Question: Please provide the solution and graphs. 1. Use the frequency distribution table to answer letters a to d. Scores of Freshmen Students in a Math

Please provide the solution and graphs.
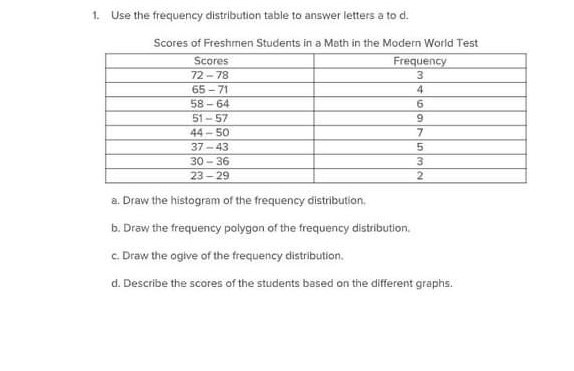
1. Use the frequency distribution table to answer letters a to d. Scores of Freshmen Students in a Math in the Modern World Test Scores Frequency 72 -78 3 65 - 71 58 - 64 6 51 -57 44 -50 37 -43 30 -36 23 - 29 a. Draw the histogram of the frequency distribution, b. Draw the frequency polygon of the frequency distribution, c. Draw the ogive of the frequency distribution. d. Describe the scores of the students based on the different graphs
Step by Step Solution
There are 3 Steps involved in it
1 Expert Approved Answer
Step: 1 Unlock

Question Has Been Solved by an Expert!
Get step-by-step solutions from verified subject matter experts
Step: 2 Unlock
Step: 3 Unlock