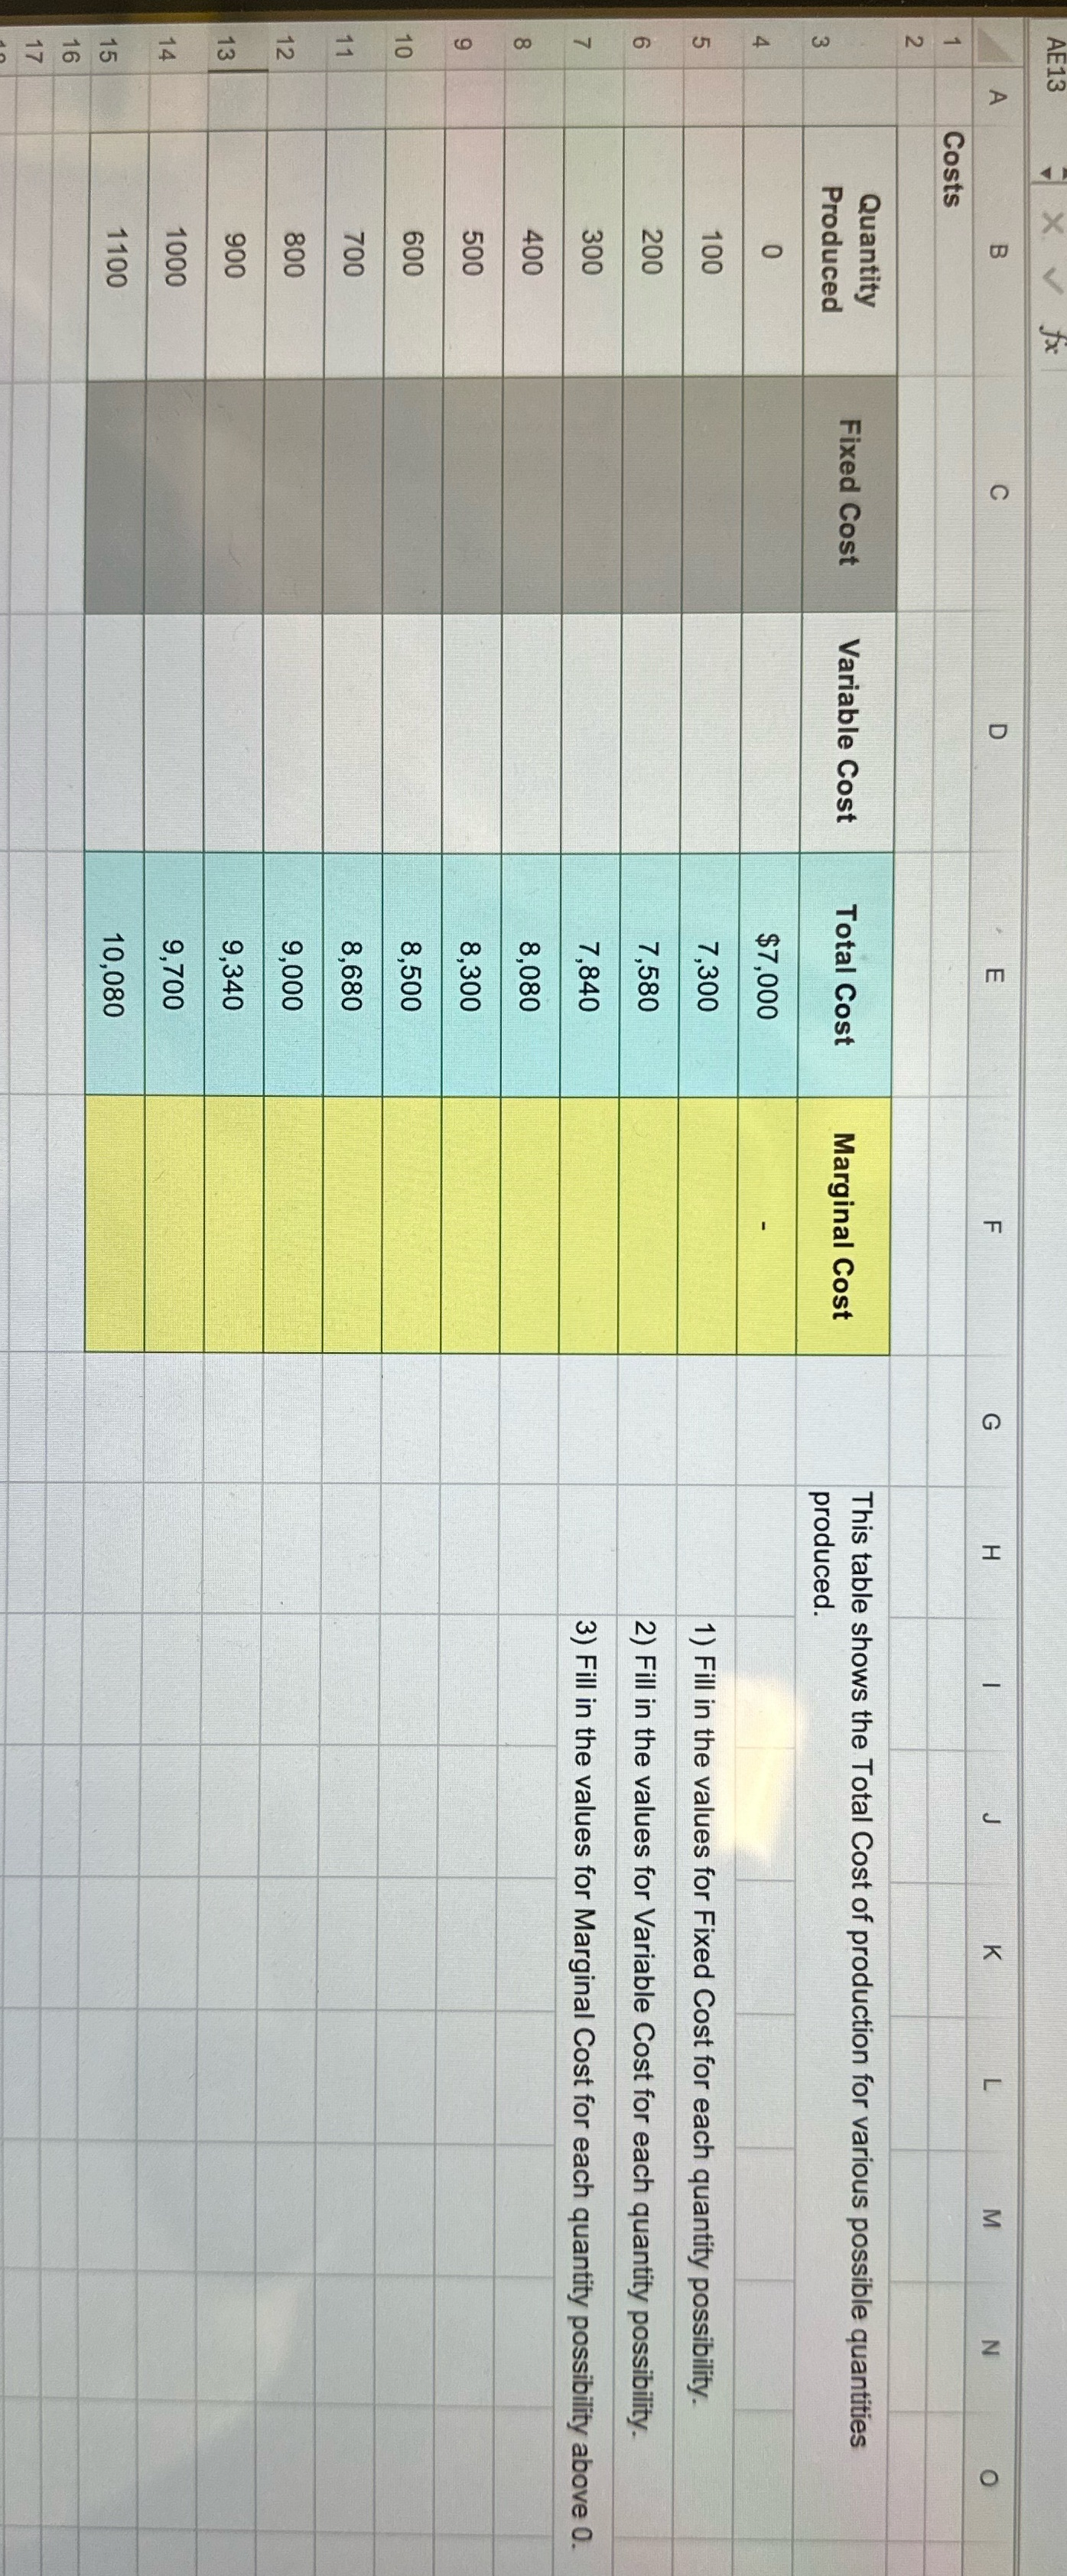
Question: **Please provide us with the cell formulas to input into the spreadsheet.** X Z O O LL I Costs Quantity This table shows the Total
**Please provide us with the cell formulas to input into the spreadsheet.**
X Z O O LL I Costs Quantity This table shows the Total Cost of production for various possible quantities Fixed Cost Variable Cost Total Cost Produced Marginal Cost produced. $7,000 100 7,300 1) Fill in the values for Fixed Cost for each quantity possibility. LO 200 7,580 2) Fill in the values for Variable Cost for each quantity possibility. CO 300 7,840 3) Fill in the values for Marginal Cost for each quantity possibility above 0. 400 8,080 500 8,300 600 8,500 700 8,680 800 9,000 900 9,340 1000 9,700 1100 10,080 LOA B C D E F Total Revenue (TR) and Marginal Revenue (MR) Price Quantity TR MR $21 0 0 5 20 100 2,000 $2,000.00 6 19 200 3,800 $1,800.00 18 300 5,400 $1,600.00 8 17 400 6,800 $1,400.00 16 500 8,000 $1,200.00 10 15 600 9,000 $1,000.00 11 14 700 9,800 $800.00 12 13 800 10,400 $600.00 13 12 900 10,800 $400.00 14 11 1000 11,000 $200.00 15 10 1100 11,000 $0.00 16