

Question: Please provide your answer here Question 6 Bartman Industries and Reynolds Inc's stock prices and dividends, along with Wilshire 5000 Index, are shown on the
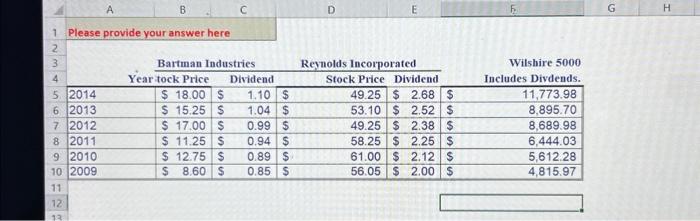
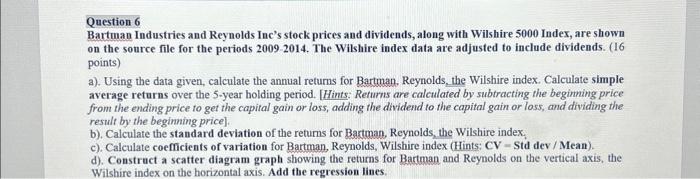
Please provide your answer here Question 6 Bartman Industries and Reynolds Inc's stock prices and dividends, along with Wilshire 5000 Index, are shown on the source file for the periods 2009-2014. The Wilshire index data are adjusted to include dividends. (I6 points) a). Using the data given, calculate the annual returns for Bartman, Reynolds, the Wilshire index. Calculate simple average returns over the 5-year holding period. [Hints: Returns are calculated by subtracting the beginning price from the ending price to get the capital gain or loss, adding the dividend to the capital gain or loss, and dividing the result by the beginning price]. b). Calculate the standard deviation of the returns for Bartman, Reynolds, the Wilshire index. c). Calculate coefficients of variation for Bartman, Reynolds, Wilshire index (Hints: CV=Std dev / Mean). d). Construct a scatter diagram graph showing the returns for Bartman and Reynolds on the vertical axis, the Wilshire index on the horizontal axis. Add the regression lines
Step by Step Solution
There are 3 Steps involved in it

Get step-by-step solutions from verified subject matter experts