

Question: Please put in excel data table with rows and columns and please provide both answer and formula. Thank you. 84 Learning Urat 16- Gross profit
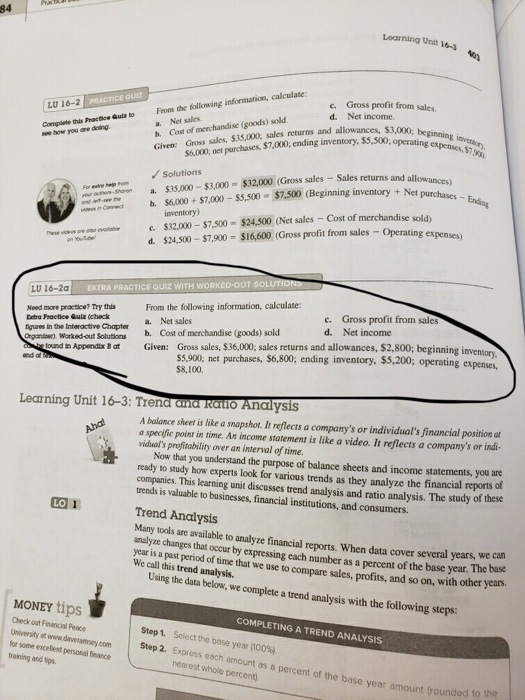
84 Learning Urat 16- Gross profit from sales. Net income. Quiz e. LU 16-2 PRSTICE Or d. a. Net sales b. Cost of merchandise (goods) sold Given: Gross sales, $35,000, sales returns and allowances s Quls to From the following information, calculate to Compiate this Practice see how you are doing $6,000, net purchases, $7,000,ending inventory, 5,500opratinning Solutions Sales returns and allow n + Net purchases -Endng For ete a. S35 000-53 000-$32.000 (Gross sales -, no $6,000+$7.000-$5,500 $7.500 (Beginning inventory Net c. S32.000-$7,500=$24.500 oet sales-cost ofmerchandise sold, d. $24,500-$7,900 $16,600 (Gross profit from sales - Operating ex inventory ono- heeve soL EXTRA PRACTICE QUIZ WITH LU 16-2a Nood more practice? Try thls From the following information, calculate: Extra Peactice Quiz (check tgures in the Intenactive Chapter b. Cost of merchandise (goods) sold Organinen). Worked out Solutions c. d. Gross profit from sales Net income a. Net sales ound i Appendix B at Given: Gross sales, $36,000, sales returns and allowances, $2,800; beginning inventorv ss,900; net purchases, $6,800, ending inventory, $5,200, operating expenses, $8,100. Learning Unit 16-3: Trena and Raito Analysis A balance sheet is like a snapshot. It reflects a company's or individual's financial position at a specific point in time. An income statement is like a video. It reflects a company's or indi- vidual's profitability over an interval of time. Now that you understand the purpose of balance sheets and income statements, you are ready to study how experts look for various trends as they analyze the financial reports of companies. This learning unit discusses trend analysis and ratio analysis. The study ot trends is valuable to businesses, financial institutions, and consumers. these LO Trend Analysis Many tools are available to analyze financial reports. When data cover several years, we can analyze changes that occur by expressing each number as a percent of the base year. The base year is a past period of time that we use to compare sales, profits, and so on, with other years. We call this trend analysis. Using the data below, we complete a trend analysis with the following steps: MONEY tips Check out Finencial Peace University ot www.davesamsey.com for some excelent personal finance training and tips COMPLETING A TREND ANALYSIS Step 1, Sciect the base year (100% Step 2. Express each amount as a percent of the ba nearest whole percent) se year amount (rounded to the
Step by Step Solution
There are 3 Steps involved in it

Get step-by-step solutions from verified subject matter experts