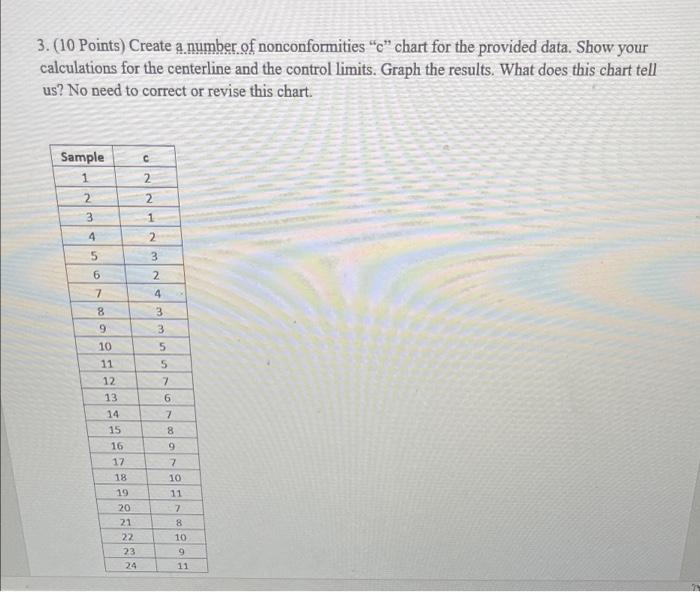
Question: please put in excel th tan Sem $ . 1 - 1 3.(10 Points) Create a number of nonconformities c chart for the provided data.

please put in excel
please put in excel th tan Sem $ . 1 - 1 3.(10
th tan Sem $ . 1 - 1 3.(10 Points) Create a number of nonconformities "c" chart for the provided data. Show your calculations for the centerline and the control limits. Graph the results. What does this chart tell us? No need to correct or revise this chart. c Sample 1 2 2 2 3 1 4 2 5 3 6 NE 7 8 9 2 4 3 3 5 5 10 11 12 13 14 15 16 17 18 7 6 7 8 9 7 19 999 SNR 20 21 22 23 24 10 11 7 8 10 9

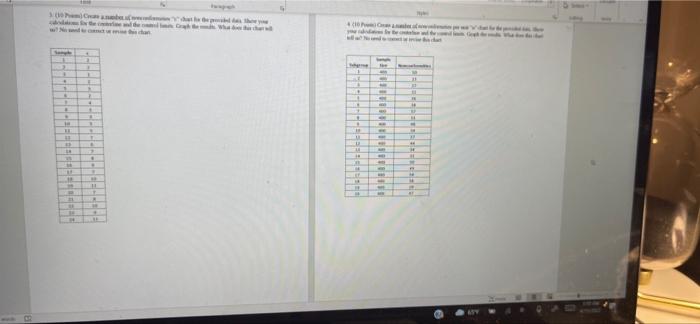
Step by Step Solution

There are 3 Steps involved in it

1 Expert Approved Answer
Step: 1 Unlock blur-text-image
Question Has Been Solved by an Expert!

Get step-by-step solutions from verified subject matter experts

Step: 2 Unlock
Step: 3 Unlock

Students Have Also Explored These Related General Management Questions!