Question: please put it in a excel format and show the formulas used in the excel cells Hope Investments, founded by John Hope, is considering the
please put it in a excel format and show the formulas used in the excel cells
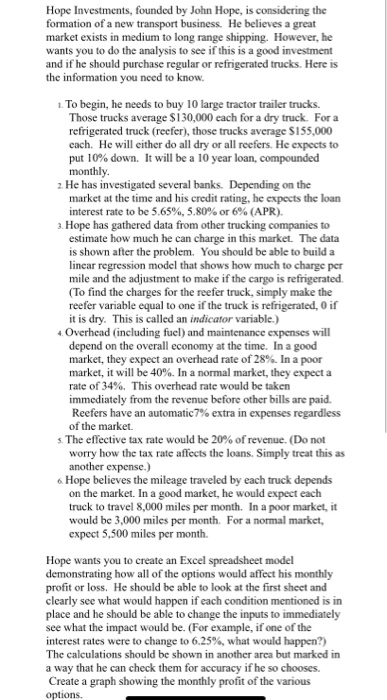
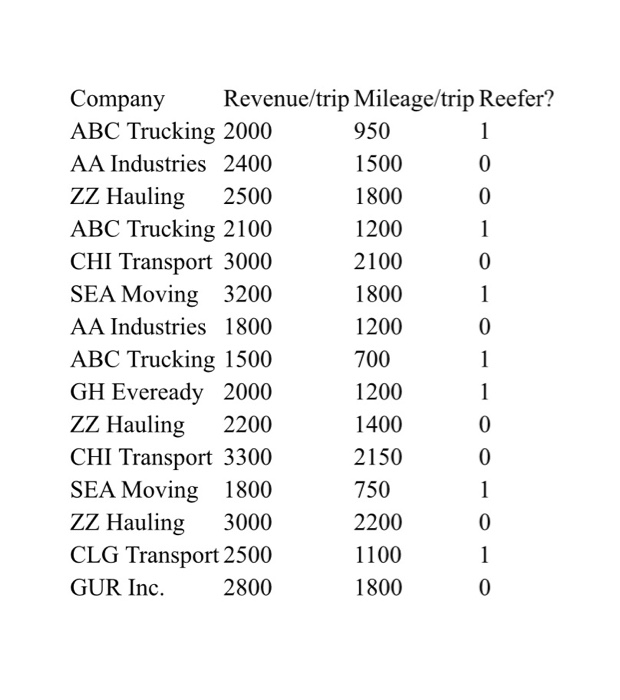
Hope Investments, founded by John Hope, is considering the formation of a new transport business. He believes a great market exists in medium to long range shipping. However, he wants you to do the analysis to see if this is a good investment and if he should purchase regular or refrigerated trucks. Here is the information you need to know. 1. To begin, he needs to buy 10 large tractor trailer trucks. Those trucks average $130,000 each for a dry truck. For a refrigerated truck (recfer), those trucks average $155,000 cach. He will either do all dry or all reefers. He expects to put 10% down. It will be a 10 year loan, compounded monthly 2. He has investigated several banks. Depending on the market at the time and his credit rating, he expects the loan interest rate to be 5.65%, 5.80% or 6% (APR). 3. Hope has gathered data from other trucking companies to estimate how much he can charge in this market. The data is shown after the problem. You should be able to build a linear regression model that shows how much to charge per mile and the adjustment to make if the cargo is refrigerated. (To find the charges for the reefer truck, simply make the reefer variable equal to one if the truck is refrigerated, if it is dry. This is called an indicator variable.) Overhead (including fuel) and maintenance expenses will depend on the overall economy at the time. In a good market, they expect an overhead rate of 28%. In a poor market, it will be 40%. In a normal market, they expect a rate of 34%. This overhead rate would be taken immediately from the revenue before other bills are paid. Reefers have an automatic7% extra in expenses regardless of the market. s. The effective tax rate would be 20% of revenue. (Do not worry how the tax rate affects the loans. Simply treat this as another expense.) 6 Hope believes the mileage traveled by each truck depends on the market. In a good market, he would expect each truck to travel 8,000 miles per month. In a poor market, it would be 3,000 miles per month. For a normal market, expect 5.500 miles per month Hope wants you to create an Excel spreadsheet model demonstrating how all of the options would affect his monthly profit or loss. He should be able to look at the first sheet and clearly see what would happen if each condition mentioned is in place and he should be able to change the inputs to immediately see what the impact would be. (For example, if one of the interest rates were to change to 6.25%, what would happen?) The calculations should be shown in another area but marked in a way that he can check them for accuracy if he so chooses. Create a graph showing the monthly profit of the various options. Hope Investments, founded by John Hope, is considering the formation of a new transport business. He believes a great market exists in medium to long range shipping. However, he wants you to do the analysis to see if this is a good investment and if he should purchase regular or refrigerated trucks. Here is the information you need to know. 1. To begin, he needs to buy 10 large tractor trailer trucks. Those trucks average $130,000 each for a dry truck. For a refrigerated truck (recfer), those trucks average $155,000 cach. He will either do all dry or all reefers. He expects to put 10% down. It will be a 10 year loan, compounded monthly 2. He has investigated several banks. Depending on the market at the time and his credit rating, he expects the loan interest rate to be 5.65%, 5.80% or 6% (APR). 3. Hope has gathered data from other trucking companies to estimate how much he can charge in this market. The data is shown after the problem. You should be able to build a linear regression model that shows how much to charge per mile and the adjustment to make if the cargo is refrigerated. (To find the charges for the reefer truck, simply make the reefer variable equal to one if the truck is refrigerated, 0 if it is dry. This is called an indicator variable.) + Overhead (including fuel) and maintenance expenses will depend on the overall economy at the time. In a good market, they expect an overhead rate of 28%. In a poor market, it will be 40%. In a normal market, they expect a rate of 34%. This overhead rate would be taken immediately from the revenue before other bills are paid. Reefers have an automatic 7% extra in expenses regardless of the market. s. The effective tax rate would be 20% of revenue. (Do not worry how the tax rate affects the loans. Simply treat this as another expense.) 6 Hope believes the mileage traveled by each truck depends on the market. In a good market, he would expect each truck to travel 8,000 miles per month. In a poor market, it would be 3,000 miles per month. For a normal market, expect 5.500 miles per month. Hope wants you to create an Excel spreadsheet model demonstrating how all of the options would affect his monthly profit or loss. He should be able to look at the first sheet and clearly see what would happen if each condition mentioned is in place and he should be able to change the inputs to immediately see what the impact would be. (For example, if one of the interest rates were to change to 6.25%, what would happen?) The calculations should be shown in another area but marked in a way that he can check them for accuracy if he so chooses. Create a graph showing the monthly profit of the various options. Company Revenue/trip Mileage/trip Reefer? ABC Trucking 2000 950 AA Industries 2400 1500 0 ZZ Hauling 2500 1800 0 ABC Trucking 2100 1200 CHI Transport 3000 2100 SEA Moving 3200 1800 AA Industries 1800 1200 ABC Trucking 1500 700 GH Eveready 2000 1200 ZZ Hauling 2200 1400 CHI Transport 3300 2150 SEA Moving 1800 750 ZZ Hauling 3000 2200 CLG Transport 2500 1100 GUR Inc. 2800 1800 Hope Investments, founded by John Hope, is considering the formation of a new transport business. He believes a great market exists in medium to long range shipping. However, he wants you to do the analysis to see if this is a good investment and if he should purchase regular or refrigerated trucks. Here is the information you need to know. 1. To begin, he needs to buy 10 large tractor trailer trucks. Those trucks average $130,000 each for a dry truck. For a refrigerated truck (recfer), those trucks average $155,000 cach. He will either do all dry or all reefers. He expects to put 10% down. It will be a 10 year loan, compounded monthly 2. He has investigated several banks. Depending on the market at the time and his credit rating, he expects the loan interest rate to be 5.65%, 5.80% or 6% (APR). 3. Hope has gathered data from other trucking companies to estimate how much he can charge in this market. The data is shown after the problem. You should be able to build a linear regression model that shows how much to charge per mile and the adjustment to make if the cargo is refrigerated. (To find the charges for the reefer truck, simply make the reefer variable equal to one if the truck is refrigerated, if it is dry. This is called an indicator variable.) Overhead (including fuel) and maintenance expenses will depend on the overall economy at the time. In a good market, they expect an overhead rate of 28%. In a poor market, it will be 40%. In a normal market, they expect a rate of 34%. This overhead rate would be taken immediately from the revenue before other bills are paid. Reefers have an automatic7% extra in expenses regardless of the market. s. The effective tax rate would be 20% of revenue. (Do not worry how the tax rate affects the loans. Simply treat this as another expense.) 6 Hope believes the mileage traveled by each truck depends on the market. In a good market, he would expect each truck to travel 8,000 miles per month. In a poor market, it would be 3,000 miles per month. For a normal market, expect 5.500 miles per month Hope wants you to create an Excel spreadsheet model demonstrating how all of the options would affect his monthly profit or loss. He should be able to look at the first sheet and clearly see what would happen if each condition mentioned is in place and he should be able to change the inputs to immediately see what the impact would be. (For example, if one of the interest rates were to change to 6.25%, what would happen?) The calculations should be shown in another area but marked in a way that he can check them for accuracy if he so chooses. Create a graph showing the monthly profit of the various options. Hope Investments, founded by John Hope, is considering the formation of a new transport business. He believes a great market exists in medium to long range shipping. However, he wants you to do the analysis to see if this is a good investment and if he should purchase regular or refrigerated trucks. Here is the information you need to know. 1. To begin, he needs to buy 10 large tractor trailer trucks. Those trucks average $130,000 each for a dry truck. For a refrigerated truck (recfer), those trucks average $155,000 cach. He will either do all dry or all reefers. He expects to put 10% down. It will be a 10 year loan, compounded monthly 2. He has investigated several banks. Depending on the market at the time and his credit rating, he expects the loan interest rate to be 5.65%, 5.80% or 6% (APR). 3. Hope has gathered data from other trucking companies to estimate how much he can charge in this market. The data is shown after the problem. You should be able to build a linear regression model that shows how much to charge per mile and the adjustment to make if the cargo is refrigerated. (To find the charges for the reefer truck, simply make the reefer variable equal to one if the truck is refrigerated, 0 if it is dry. This is called an indicator variable.) + Overhead (including fuel) and maintenance expenses will depend on the overall economy at the time. In a good market, they expect an overhead rate of 28%. In a poor market, it will be 40%. In a normal market, they expect a rate of 34%. This overhead rate would be taken immediately from the revenue before other bills are paid. Reefers have an automatic 7% extra in expenses regardless of the market. s. The effective tax rate would be 20% of revenue. (Do not worry how the tax rate affects the loans. Simply treat this as another expense.) 6 Hope believes the mileage traveled by each truck depends on the market. In a good market, he would expect each truck to travel 8,000 miles per month. In a poor market, it would be 3,000 miles per month. For a normal market, expect 5.500 miles per month. Hope wants you to create an Excel spreadsheet model demonstrating how all of the options would affect his monthly profit or loss. He should be able to look at the first sheet and clearly see what would happen if each condition mentioned is in place and he should be able to change the inputs to immediately see what the impact would be. (For example, if one of the interest rates were to change to 6.25%, what would happen?) The calculations should be shown in another area but marked in a way that he can check them for accuracy if he so chooses. Create a graph showing the monthly profit of the various options. Company Revenue/trip Mileage/trip Reefer? ABC Trucking 2000 950 AA Industries 2400 1500 0 ZZ Hauling 2500 1800 0 ABC Trucking 2100 1200 CHI Transport 3000 2100 SEA Moving 3200 1800 AA Industries 1800 1200 ABC Trucking 1500 700 GH Eveready 2000 1200 ZZ Hauling 2200 1400 CHI Transport 3300 2150 SEA Moving 1800 750 ZZ Hauling 3000 2200 CLG Transport 2500 1100 GUR Inc. 2800 1800