

Question: Please qiuckly Question # 2 (13 Points): Figure 2 presents the load demand profile over 24 hours, redraw the load profile considering the following DSI
Please qiuckly
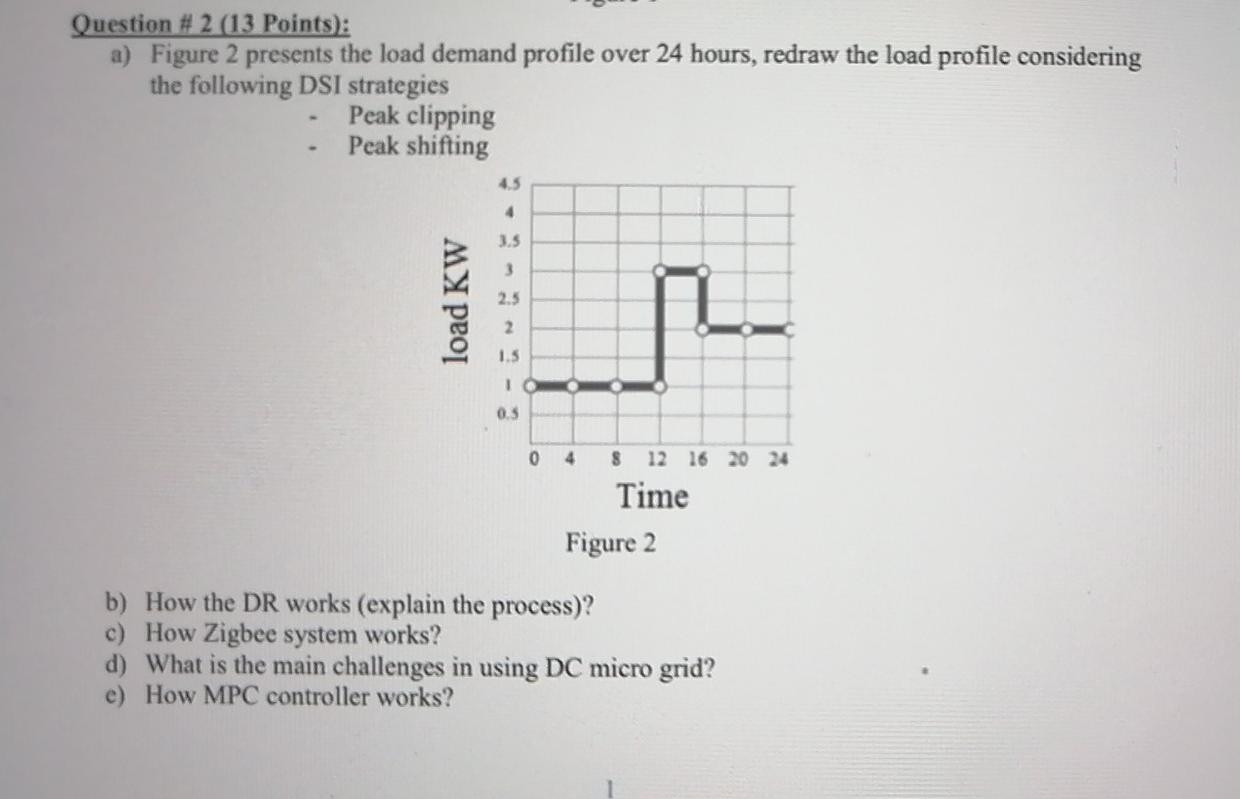
Question # 2 (13 Points): Figure 2 presents the load demand profile over 24 hours, redraw the load profile considering the following DSI strategies Peak clipping Peak shifting 4.5 4 3.5 3 load KW 2.5 2 1.5 IO 0.3 0 4 8 12 16 20 24 Time Figure 2 b) How the DR works (explain the process)? c) How Zigbee system works? d) What is the main challenges in using DC micro grid? e) How MPC controller works
Step by Step Solution
There are 3 Steps involved in it
1 Expert Approved Answer
Step: 1 Unlock

Question Has Been Solved by an Expert!
Get step-by-step solutions from verified subject matter experts
Step: 2 Unlock
Step: 3 Unlock