

Question: PLEASE READ BEFORE HELPING!!!!!! The data provided in the light blue boxes is correct, however, I need the cell formulas or a walk-through on how
PLEASE READ BEFORE HELPING!!!!!!
The data provided in the light blue boxes is correct, however, I need the cell formulas or a walk-through on how each light blue cell was calculated. In the last screenshot (no light blue boxes), I provided the FCFE and FCFF statement calculations in case in of those numbers are needed to solve for the light blue cells. Thank you in advance.
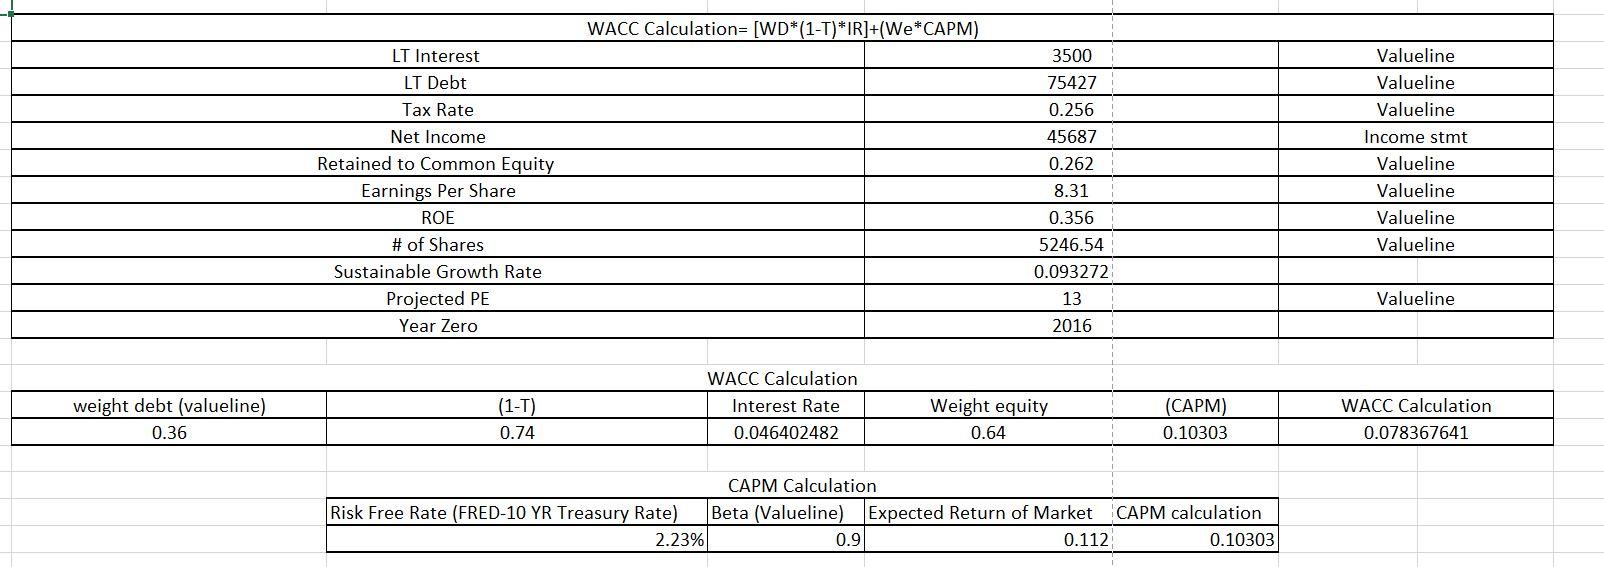
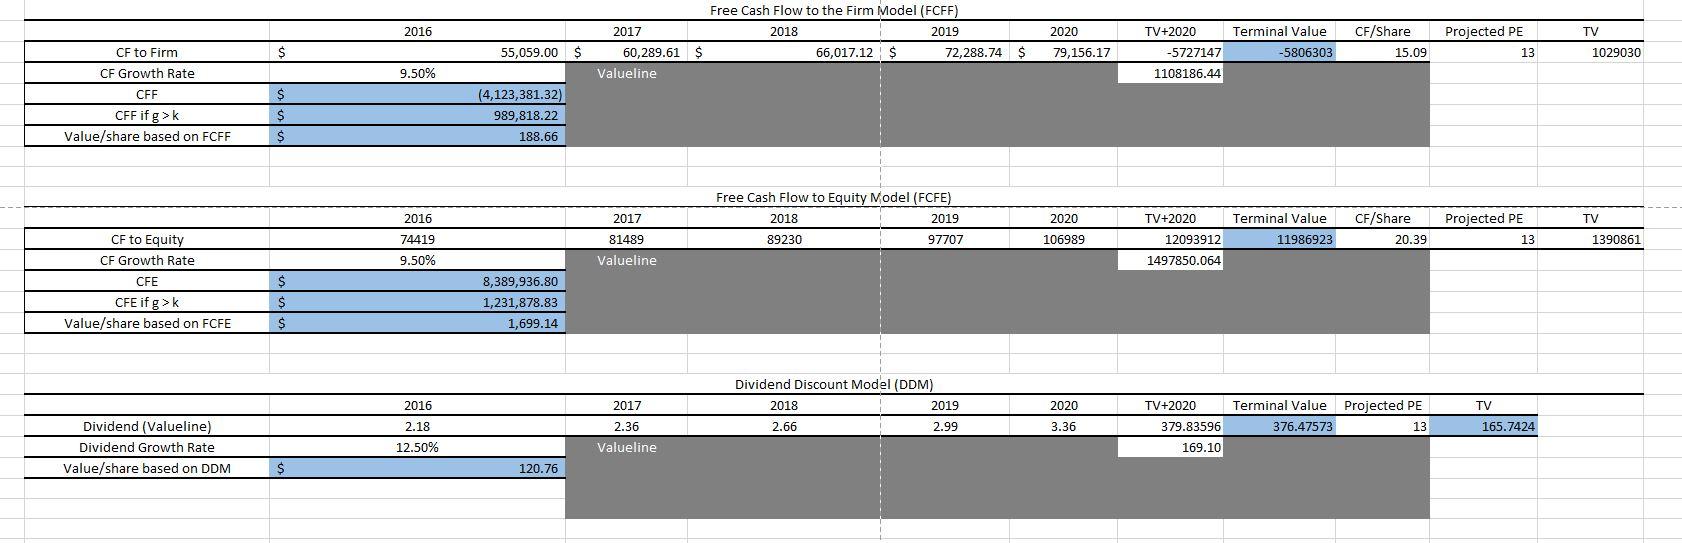
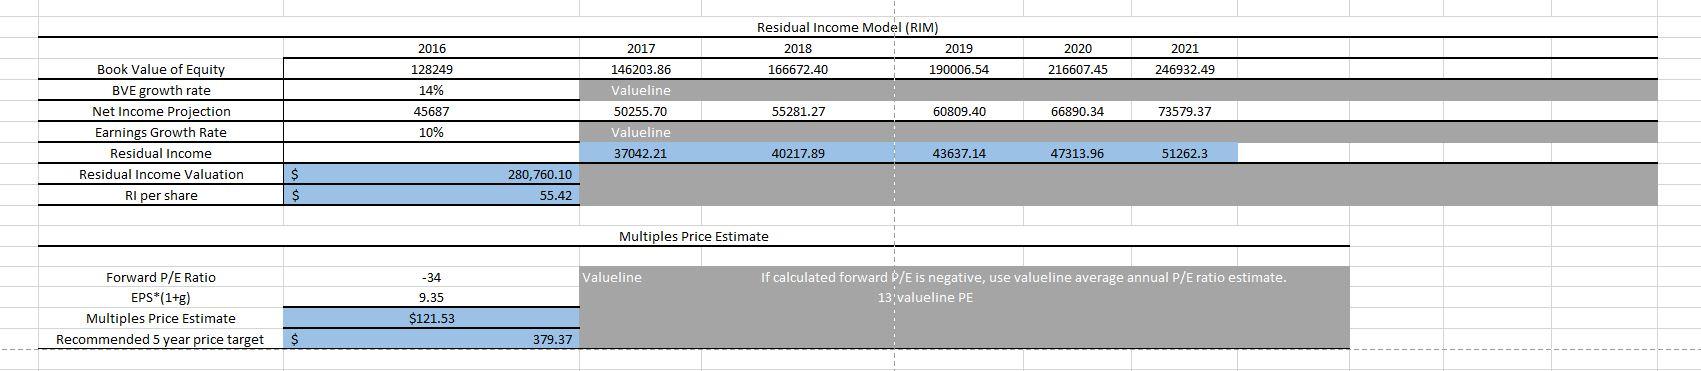
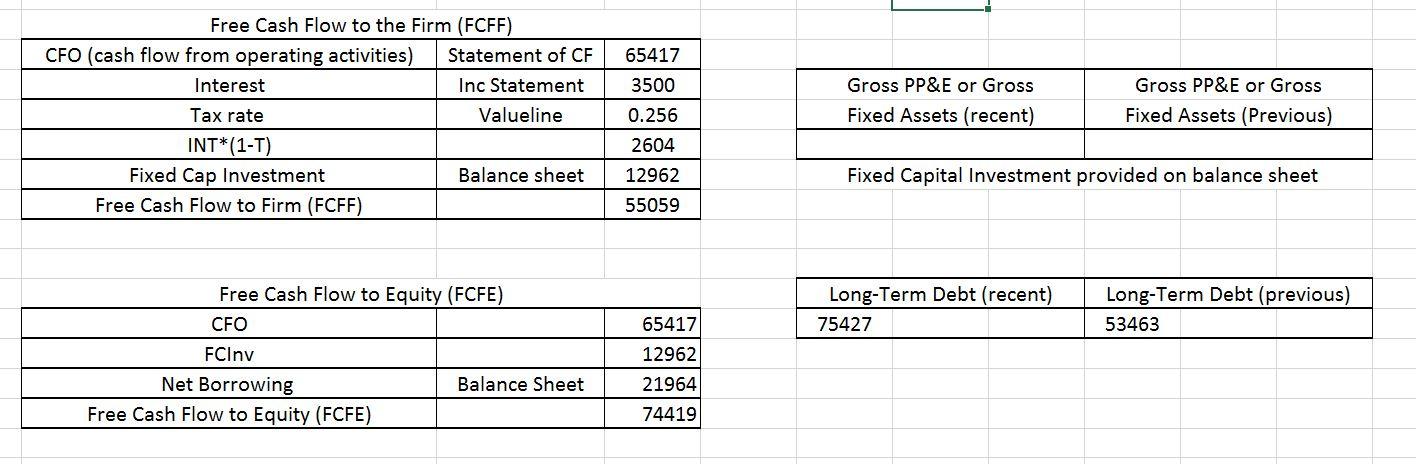
WACC Calculation= [WD*(1-T)*IR]+(We* CAPM) 3500 LT Interest LT Debt Tax Rate Net Income Retained to Common Equity Earnings Per Share ROE # of Shares Sustainable Growth Rate Projected PE Year Zero 75427 0.256 45687 0.262 8.31 Valueline Valueline Valueline Income stmt Valueline Valueline Valueline Valueline 0.356 5246.54 0.093272 13 2016 Valueline weight debt (valueline) 0.36 (1-T) 0.74 WACC Calculation Interest Rate 0.046402482 Weight equity 0.64 (CAPM) 0.10303 WACC Calculation 0.078367641 CAPM Calculation Risk Free Rate (FRED-10 YR Treasury Rate) Beta (Valueline) Expected Return of Market CAPM calculation 2.23% 0.9 0.112 0.10303 2016 2017 Free Cash Flow to the Firm Model (FCFF) 2018 2019 66,017.12 $ 72,288.74 $ 2020 TV+2020 TV Terminal Value -5806303 CF/Share 15.09 Projected PE 13 s 55,059.00 $ 79,156.17 1029030 60,289.61 $ Valueline -5727147 1108186.44 9.50% CF to Firm CF Growth Rate CFF CFF if g>k Value/share based on FCFF $ $ $ (4,123,381.32) 989,818.22 188.66 2017 Free Cash Flow to Equity Model (FCFE) 2018 2019 89230 97707 2020 CF/Share 2016 74419 9.50% TV Terminal Value 11986923 TV+2020 12093912 1497850.064 Projected PE 13 106989 20.39 1390861 81489 Valueline CF to Equity CF Growth Rate CFE CFE if g > Value/share based on FCFE $ $ $ 8,389,936.80 1,231,878.83 1,699.14 2020 Dividend Discount Model (DDM) 2018 2019 2.66 2.99 TV 2016 2.18 12.50% 2017 2.36 Valueline Terminal Value Projected PE 376.47573 13 Dividend (Valueline) Dividend Growth Rate Value/share based on DDM 3.36 TV+2020 379.83596 169.10 165.7424 $ 120.76 Residual Income Model (RIM) 2018 2019 166672.40 190006.54 2021 2020 216607.45 246932.49 2016 128249 14% 45687 10% 2017 146203.86 Valueline 50255.70 Valueline 37042.21 55281.27 60809.40 Book Value of Equity BVE growth rate Net Income Projection Earnings Growth Rate Residual Income Residual Income Valuation RI per share 66890.34 73579.37 40217.89 43637.14 47313.96 51262.3 $ 280,760.10 55.42 Multiples Price Estimate Valueline Forward P/E Ratio EPS*(1+g) Multiples Price Estimate Recommended 5 year price target -34 9.35 $121.53 If calculated forward P/E is negative, use valueline average annual P/E ratio estimate. 13:valueline PE $ 379.37 65417 3500 Free Cash Flow to the Firm (FCFF) CFO (cash flow from operating activities) Statement of CF Interest Inc Statement Tax rate Valueline INT*(1-T) Fixed Cap Investment Balance sheet Free Cash Flow to Firm (FCFF) Gross PP&E or Gross Fixed Assets (recent) Gross PP&E or Gross Fixed Assets (Previous) 0.256 2604 12962 Fixed Capital Investment provided on balance sheet 55059 Free Cash Flow to Equity (FCFE) CFO Long-Term Debt (recent) 75427 Long-Term Debt (previous) 53463 65417 FCInv 12962 Balance Sheet 21964 Net Borrowing Free Cash Flow to Equity (FCFE) 74419 WACC Calculation= [WD*(1-T)*IR]+(We* CAPM) 3500 LT Interest LT Debt Tax Rate Net Income Retained to Common Equity Earnings Per Share ROE # of Shares Sustainable Growth Rate Projected PE Year Zero 75427 0.256 45687 0.262 8.31 Valueline Valueline Valueline Income stmt Valueline Valueline Valueline Valueline 0.356 5246.54 0.093272 13 2016 Valueline weight debt (valueline) 0.36 (1-T) 0.74 WACC Calculation Interest Rate 0.046402482 Weight equity 0.64 (CAPM) 0.10303 WACC Calculation 0.078367641 CAPM Calculation Risk Free Rate (FRED-10 YR Treasury Rate) Beta (Valueline) Expected Return of Market CAPM calculation 2.23% 0.9 0.112 0.10303 2016 2017 Free Cash Flow to the Firm Model (FCFF) 2018 2019 66,017.12 $ 72,288.74 $ 2020 TV+2020 TV Terminal Value -5806303 CF/Share 15.09 Projected PE 13 s 55,059.00 $ 79,156.17 1029030 60,289.61 $ Valueline -5727147 1108186.44 9.50% CF to Firm CF Growth Rate CFF CFF if g>k Value/share based on FCFF $ $ $ (4,123,381.32) 989,818.22 188.66 2017 Free Cash Flow to Equity Model (FCFE) 2018 2019 89230 97707 2020 CF/Share 2016 74419 9.50% TV Terminal Value 11986923 TV+2020 12093912 1497850.064 Projected PE 13 106989 20.39 1390861 81489 Valueline CF to Equity CF Growth Rate CFE CFE if g > Value/share based on FCFE $ $ $ 8,389,936.80 1,231,878.83 1,699.14 2020 Dividend Discount Model (DDM) 2018 2019 2.66 2.99 TV 2016 2.18 12.50% 2017 2.36 Valueline Terminal Value Projected PE 376.47573 13 Dividend (Valueline) Dividend Growth Rate Value/share based on DDM 3.36 TV+2020 379.83596 169.10 165.7424 $ 120.76 Residual Income Model (RIM) 2018 2019 166672.40 190006.54 2021 2020 216607.45 246932.49 2016 128249 14% 45687 10% 2017 146203.86 Valueline 50255.70 Valueline 37042.21 55281.27 60809.40 Book Value of Equity BVE growth rate Net Income Projection Earnings Growth Rate Residual Income Residual Income Valuation RI per share 66890.34 73579.37 40217.89 43637.14 47313.96 51262.3 $ 280,760.10 55.42 Multiples Price Estimate Valueline Forward P/E Ratio EPS*(1+g) Multiples Price Estimate Recommended 5 year price target -34 9.35 $121.53 If calculated forward P/E is negative, use valueline average annual P/E ratio estimate. 13:valueline PE $ 379.37 65417 3500 Free Cash Flow to the Firm (FCFF) CFO (cash flow from operating activities) Statement of CF Interest Inc Statement Tax rate Valueline INT*(1-T) Fixed Cap Investment Balance sheet Free Cash Flow to Firm (FCFF) Gross PP&E or Gross Fixed Assets (recent) Gross PP&E or Gross Fixed Assets (Previous) 0.256 2604 12962 Fixed Capital Investment provided on balance sheet 55059 Free Cash Flow to Equity (FCFE) CFO Long-Term Debt (recent) 75427 Long-Term Debt (previous) 53463 65417 FCInv 12962 Balance Sheet 21964 Net Borrowing Free Cash Flow to Equity (FCFE) 74419
Step by Step Solution
There are 3 Steps involved in it

Get step-by-step solutions from verified subject matter experts