

Question: PLEASE READ CAREFULLY ALL INFORMATION IS BELOW (b) Use a 95% confidence interval to test if there is a difference in braking time with impaired
PLEASE READ CAREFULLY ALL INFORMATION IS BELOW
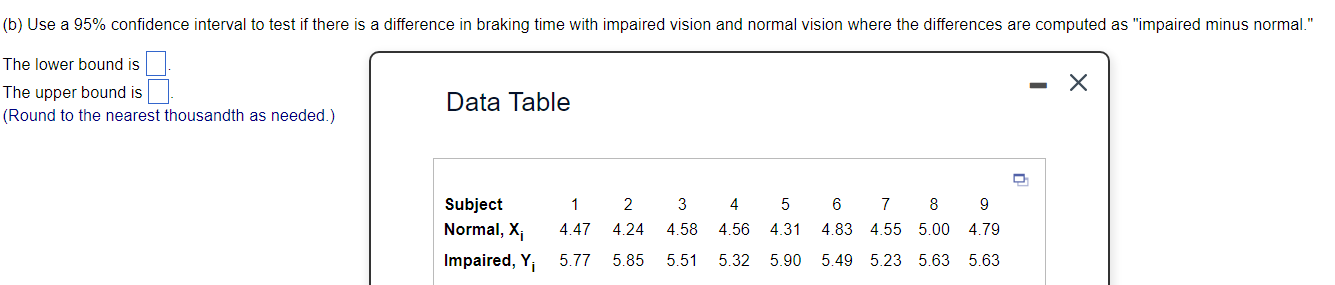
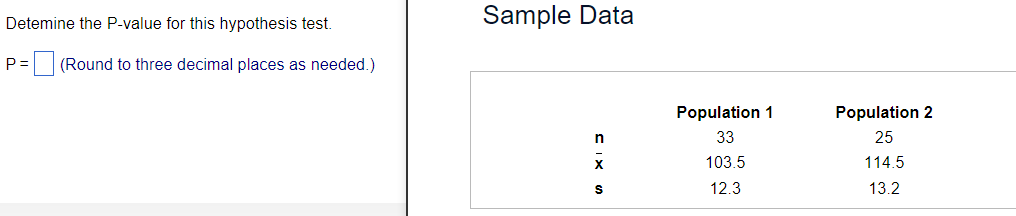
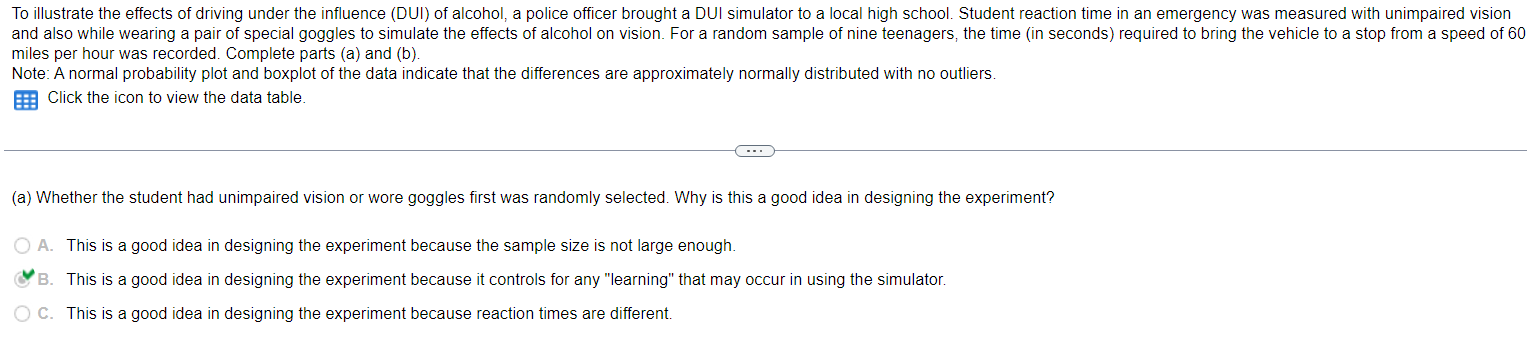


(b) Use a 95% confidence interval to test if there is a difference in braking time with impaired vision and normal vision where the differences are computed as "impaired minus normal." The lower bound is The upper bound is -X Data Table (Round to the nearest thousandth as needed.) Subject 1 2 3 4 5 6 7 8 9 Normal, Xi 4.47 4.24 4.58 4.56 4.31 4.83 4.55 5.00 4.79 Impaired, Yi 5.77 5.85 5.51 5.32 5.90 5.49 5.23 5.63 5.63Detemine the Pvalue for this hypothesis test. sample Data P = D {Round to three decimal places as needed.) Population 1 Population 2 n 33 25 J: 103.5 114.5 s 12.3 13.2 To illustrate the effects of driving under the influence (DUI) of alcohol, a police officer brought a DUI simulator to a local high school. Student reaction time in an emergency was measured with unimpaired vision and also while wearing a pair of special goggles to simulate the effects of alcohol on vision. For a random sample of nine teenagers, the time (in seconds) required to bring the vehicle to a stop from a speed of 60 miles per hour was recorded. Complete parts (a) and (b). Note: A normal probability plot and boxplot of the data indicate that the differences are approximately normally distributed with no outliers. Click the icon to view the data table. . . . (a) Whether the student had unimpaired vision or wore goggles first was randomly selected. Why is this a good idea in designing the experiment? O A. This is a good idea in designing the experiment because the sample size is not large enough. B. This is a good idea in designing the experiment because it controls for any "learning" that may occur in using the simulator. O C. This is a good idea in designing the experiment because reaction times are different.Use the given statistics to complete parts (a) and (b). Assume that the populations are normally distributed. Population 1 Population 2 (a) Test whether , > H2 at the a= 0.01 level of significance for the given sample data. 22 20 47.4 45.1 (b) Construct a 95% confidence interval about 1 - H2- 6.9 12.8Test whether H1
Step by Step Solution
There are 3 Steps involved in it

Get step-by-step solutions from verified subject matter experts