

Question: Please read case study Toledo Custom Manufacturing: Quality Control on page 455 of the text and answer the questions from page 456. See below for
Please read case study Toledo Custom Manufacturing:
Quality Control on page 455 of the text and answer the questions from page 456. See below for additional help: The analysis for TCM is shown below. The first step is to compute the sample average and the sample range for each sample of five rods. Next, average and range control charts are constructed from the data. The grand average mean and the average range are calculated for each operator-machine combination shown on the bottom of the spreadsheet below. Each sample has its sample average and sample range.
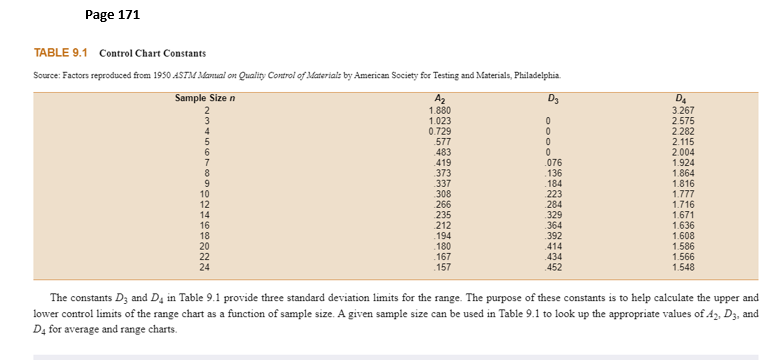
Once all 6 sample are calculated for the average and range then average the 6 for both average and range for both operator 1 and 2. These numbers will be the center lines for both the grand average and grand range for each operator. Now to calculate the UCL and LCL you will need to use the control chart constants chart on page 171* of the latest edition of the text. The results are used to calculate the UCL, CL and LCL for the average chart and then the range chart. The formulas from Chapter 9 are used for these calculations along with the constants for a sample of 5. The formula for the average is: UCL =Grand average + (sample size (5) A2* in the chart (grand range) ) LCL = Grand average - (sample size (5) A2* in the chart (grand range)) See page 171 for the example. The formula for the UCL/LCL for the range chart also requires the CL and the UCL and LCL The CL is the grand range for each operator UCL= D4* chart for (5 sample size) times the grand range LCL = D3* chart for (5 sample size) times the grand average This needs to be done as the grand average for both operators data.
Now you have the UCL, CL, and LCL for both sets of operator data. Go through and see if any of the data points fall outside these parameters. If they are outside these parameters, then the process is not in control The CP and CPK formulas are on pages 172 and 173 of the text.
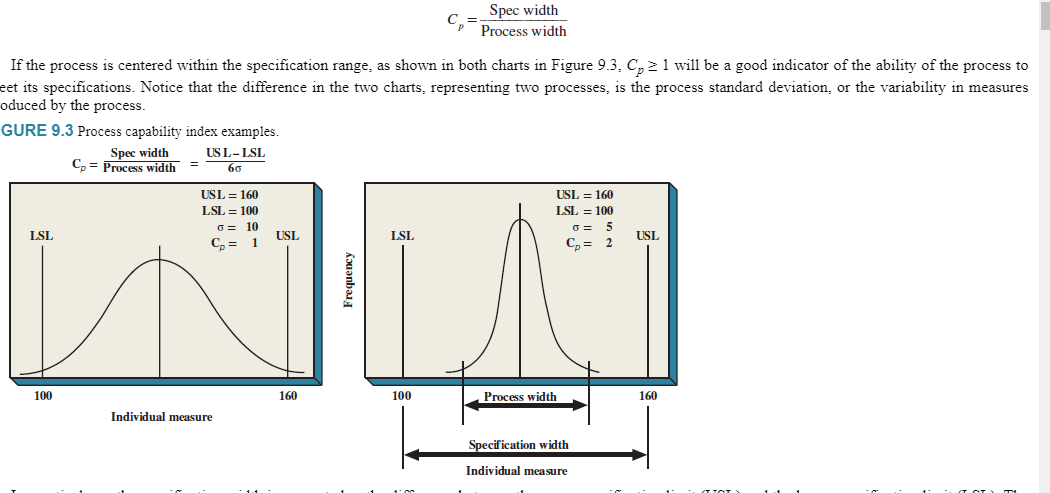
Once a process has been brought under statistical control, process capability can be assessed. Process capability is simply the ability of the process to meet or exceed the technical specifications obtained from customers. A process that is not capable of meeting specifications means that defective outputs are being produced. Moreover, it is important to remember that whether or not a process is in a state of statistical control and whether or not a process is capable are two separate issues. Just because a process is in a state of statistical control does not mean that it is capable.
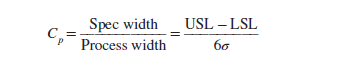
Whether or not a process is capable of meeting specifications can be determined by computing the process capability index Cpthe ratio of the specification (spec) width to the process width:
Understand that the CP uses the actual customer specifications mentioned early in the case study. The CPK uses the data collected from the earlier sample analysis. I am giving you the following information: Standard deviation of individual parts operator 1 machine 1 is .00298 Standard deviation of individual parts operator 2 machine 2 is .00468 This way you do not have to calculate the SD and can now just finish the calculations. Finally, read the case study thoroughly and after calculating the numbers required by the study apply the actual sample data to see if the processes are both in control and capable.
Toledo Custom Manufacturing (TCM), located in Toledo, Ohio, makes metal parts to customer specifications. They have a variety of machines including lathes, numerically controlled (NC) machines, grinders, and drilling machines. They can make any metal parts that require the use of these machines. TCM employs 65 workers, supervisors, and managers in its facility. TCM is very customer-oriented and prides itself on quality control. They take a Total Quality Management systems approach including the use of control charts, ISO 9000 certification, employee training, and teams for continuous improvement of quality. TCM also selects its suppliers based on their ability to provide quality metal blanks and parts that are purchased.
EXHIBIT 1Push rod and hydraulic cylinder illustration.
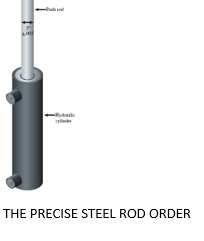
THE PRECISE STEEL ROD ORDER TCM recently received an order to machine 5000 push rods to be used in the production of hydraulic cylinders. The push rod is a precise steel rod that runs inside a hydraulic cylinder to build pressure when activated. The push rod has very tight specifications to ensure that hydraulic leaks do not occur. The rod ordered is 6" long and must be .500 inches in diameter (see Exhibit 1 for an illustration). The specifications call for .005" (5 one-thousands of an inch) tolerance. Therefore, all rods must be machined to a diameter between .495" and .505" to meet the specification and to be acceptable to the customer.
To meet the customers delivery schedule, TCM will utilize two machines, each with its own operator. The machines are similar, but Operator 1 has more experience than Operator 2. TCM must also ensure that the supplier of blank steel rods will provide consistently good material for machining.
QUALITY CONTROL CHARTS
In order to prepare for the order, TCM has decided to make 30 parts for each operator-machine combination. Each operator-machine will run samples of 5 parts and make a total of six samples for 30 parts. Separate control charts will then be constructed using the samples to calculate the grand average and average range for each operator. These averages will be used to construct an upper control limit, center line, and lower control limit for each of the operators. Then the six samples will be compared to these limits to see if the process is in-control or if there are out-of-control points. If the process is in-control, the operator and machine can proceed to make good parts. Every hour a sample of 5 will then be taken and plotted on the chart to ensure that the process is still in control. If either machine-operator combination is out of control based on the first six samples of 5 parts each, the process will need to be fixed before proceeding. After fixing the process another six samples of 5 parts each will be taken to see if the process is now in control, and this is continued until a satisfactory test is completed. The customer has asked that the final control charts used to verify the operator-machine combinations be forwarded to them along with the 60 parts produced by the two machines. They also requested that control charts be maintained by taking hourly samples and submitted along with future batches of the parts. In addition to statistical process control charts, the customer would like to receive a calculation of the process capability index (Cp and Cpk) to ensure that the process is capable of meeting the specification.
The data collected from the first six samples of 5 each are shown in Exhibit 2 for operator 1machine 1 and page 456operator 2machine 2. These are the samples required to ensure that both operator-machine processes are in control before proceeding with full production of the 5000-unit order.
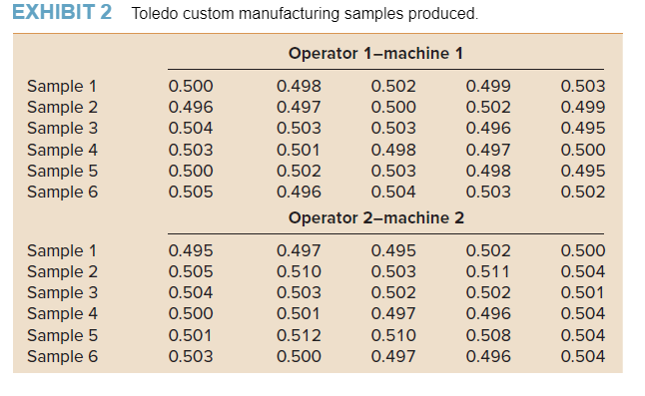
EXHIBIT 1Push rod and hydraulic cylinder illustration. Page 171
Variables Control Chart: The X & R Charts Example The Midwest Bolt Company would like to control the quality of the bolts produced. Each machine produces 100 bolts per hour and is controlled by a separate control chart. Every hour, a random sample of six bolts is selected from the output of the machine, and the diameter of each sample bolt is measured. From the six diameters, an average and range are computed. For example, one sample produced the following six diameter measurements: .536, .507, .530, .525, .530, and .520. The average of these measurements is =.525, and the range is R = .029. We also know that the grand average of all past samples is = .513 and the grand average range is = 0.020. From these, the control chart parameters are computed as follows (see Table 9.1 for control chart constants with n = 6).
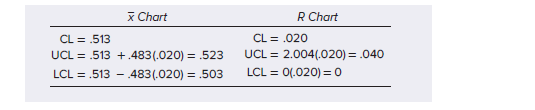
Once each sample point is plotted on the two control charts, the process is found to be out of control on average measurement and in control on the range. (Note: =.525 is outside the upper control limit on the chart, also the value of R = .029 is within its control limits). We should therefore stop the process and look for an assignable cause that is making the process produce bolts that are too large in diameter.
Discussion Questions
Calculate the control charts (UCL, CL, and LCL) for each operator-machine combination separately. Do this for both x-bar (average) and range charts. What conclusions can you draw from the charts about each operator-machine combination?
What should be done based on the calculations from question 1?
What is the process capability for each operator-machine combination?
Can you be sure that every part produced by in-control processes will meet the specification? Identify and explain any underlying assumptions for the calculations done here.
Cp=ProcesswidthSpecwidth If the process is centered within the specification range, as shown in both charts in Figure 9.3,Cp1 will be a good indicator of the ability of the process to eet its specifications. Notice that the difference in the two charts, representing two processes, is the process standard deviation, or the variability in measures oduced by the process. GURE 9.3 Process capability index examples. Cp=ProcesswidthSpecwidth=6USLLSL Cp=ProcesswidthSpecwidth=6USLLSL EXHIBIT 2 Toledo custom manufacturing samples produced. TABLE 9.1 Control Chart Constants Source: Factors reproduced from 1950 ASTM Manual on Quality Control of Materiait by American Society for Testing and Materials, Philadelphia. The constants D3 and D4 in Table 9.1 provide three standard deviation limits for the range. The purpose of these constants is to help calculate the upper and lower control limits of the range chart as a function of sample size. A given sample size can be used in Table 9.1 to look up the appropriate values of A2,D3, and D4 for average and range charts. \begin{tabular}{cc} x Chart & R Chart \\ \hline CL=.513 & CL=.020 \\ UCL=.513+.483(.020)=.523 & UCL=2.004(.020)=.040 \\ LCL=.513.483(.020)=.503 & LCL=0(.020)=0 \\ \hline \end{tabular}
Step by Step Solution
There are 3 Steps involved in it

Get step-by-step solutions from verified subject matter experts