

Question: Please read data through this: library(sleuth3) data( ex0725) Decline in Male Births. Display shows the proportion of male births in Denmark, The Netherlands, Canada, and
Please read data through this: library(sleuth3)
data( ex0725)
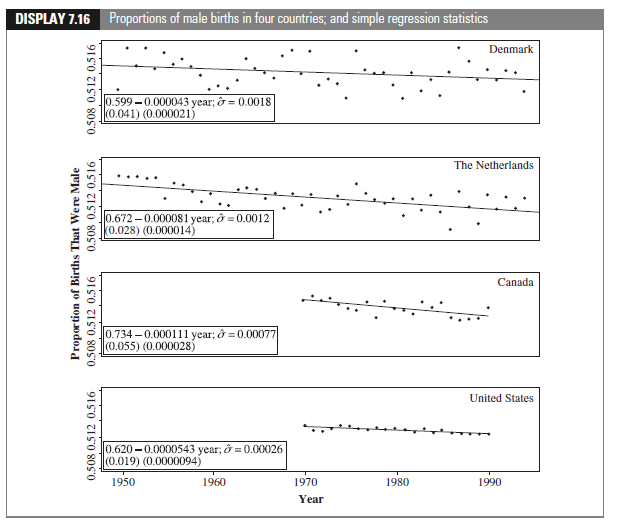
Decline in Male Births. Display shows the proportion of male births in Denmark, The
Netherlands, Canada, and the United States for a number of years. (Data read from graphs in Davis
et al., "Reduced Ratio of Male to Female Births in Several Industrial Countries," Journal of the
American Medical Association, 279 (1998): 1018-23.) Also shown are the results of least squares
fitting to the simple linear regression of proportion of males on year, separately for each country,
with standard errors of estimated coefficients in parentheses.
(a) With a statistical computer package and the data in the file ex0725, obtain the least squares
fits to the four simple regressions, individually, to confirm the estimates and standard errors
presented.
(b) Obtain the t -statistic for the test that the slopes of the regressions are zero, for each of the
four countries. Is there evidence that the proportion of male births is truly declining?
(c) Explain why the United States can have the largest of the four t -statistics (in absolute value)
even though its slope is only the third largest (in absolute value).
(d) Explain why the standard error of the estimated slope is smaller for the United States than
for Canada, even though the sample size is the same.
\f
Step by Step Solution
There are 3 Steps involved in it

Get step-by-step solutions from verified subject matter experts