

Question: Please read the case and answer the questions. How do the net costs per card compare for each card category: Current structure vs. Outsourced to
Please read the case and answer the questions.
- How do the "net" costs per card compare for each card category:
- Current structure vs.
- Outsourced to China vs.
- Factory of the future
- What's the lowest cost alternative for each card category?
- What combination of alternatives provides the total lowest cost for AG?
- How much can they save in total (annually in millions of dollars)?
- What are the strategic pros and cons to be considered before outsourcing?
Notes/assumptions:
- Shipping costs are cents per card (for all categories)
- Ignoreinventoryholdingcosts
- AssumetheFactoryoftheFutureinvestment is evenly amortized on all applicable units over 15 years
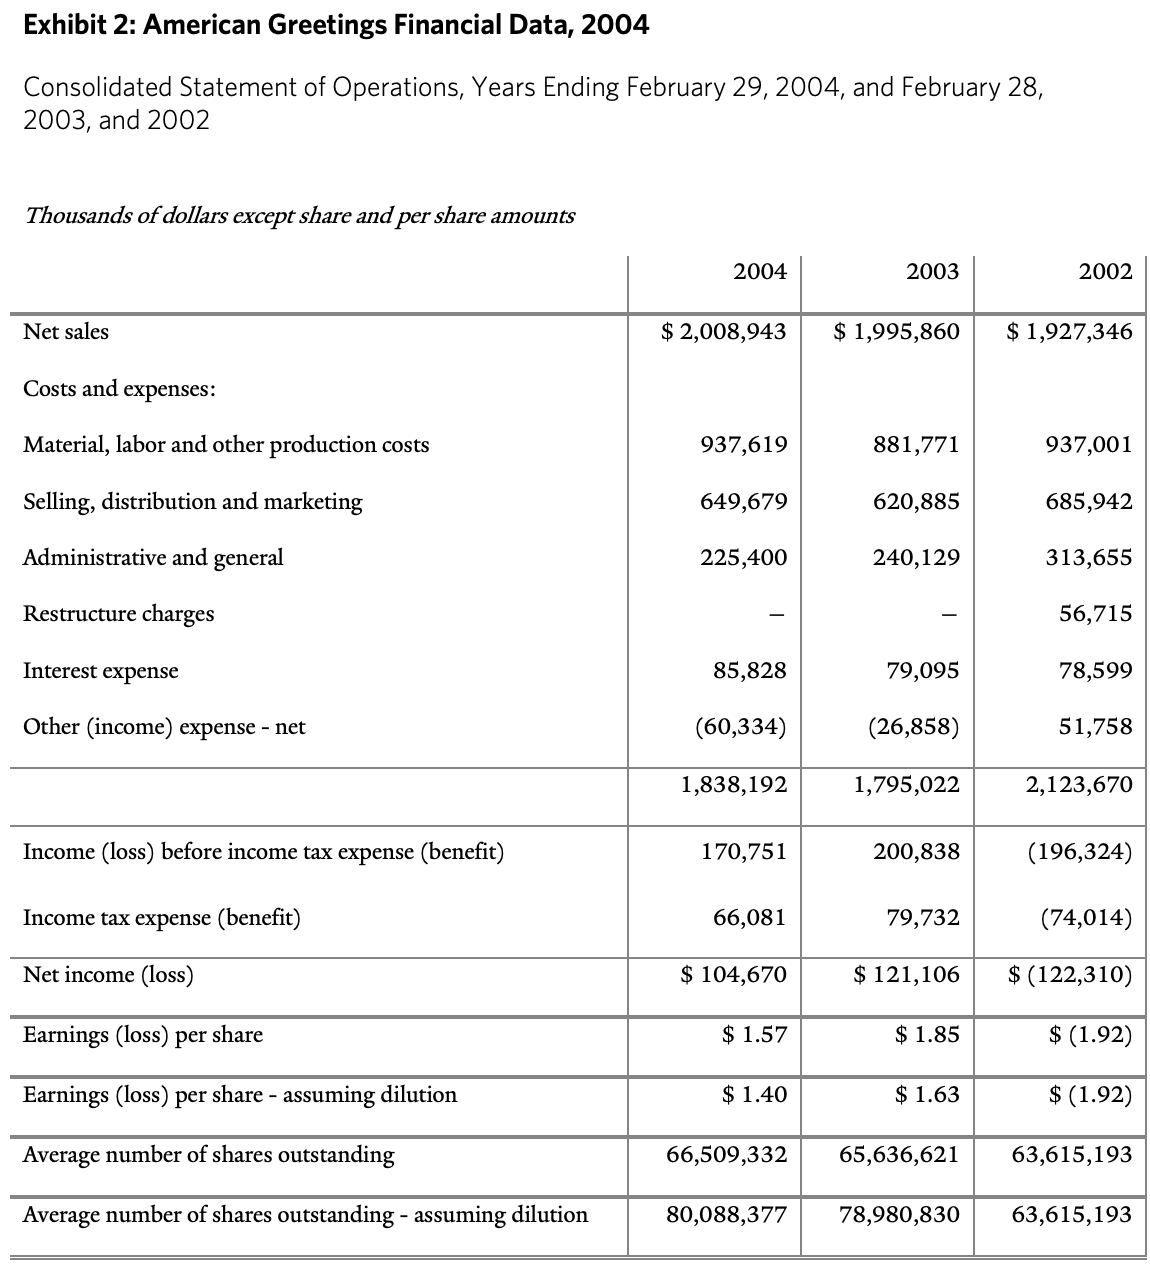
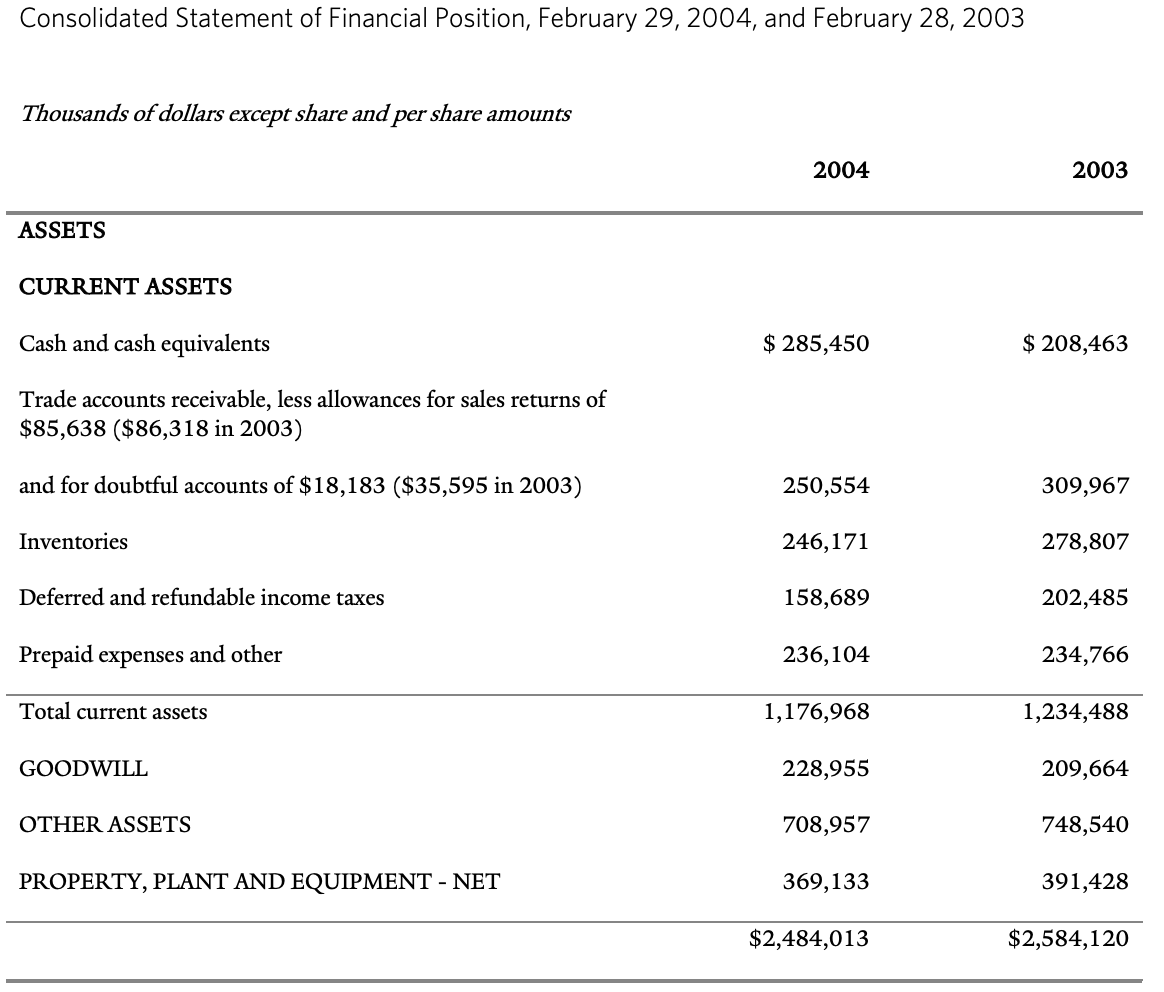
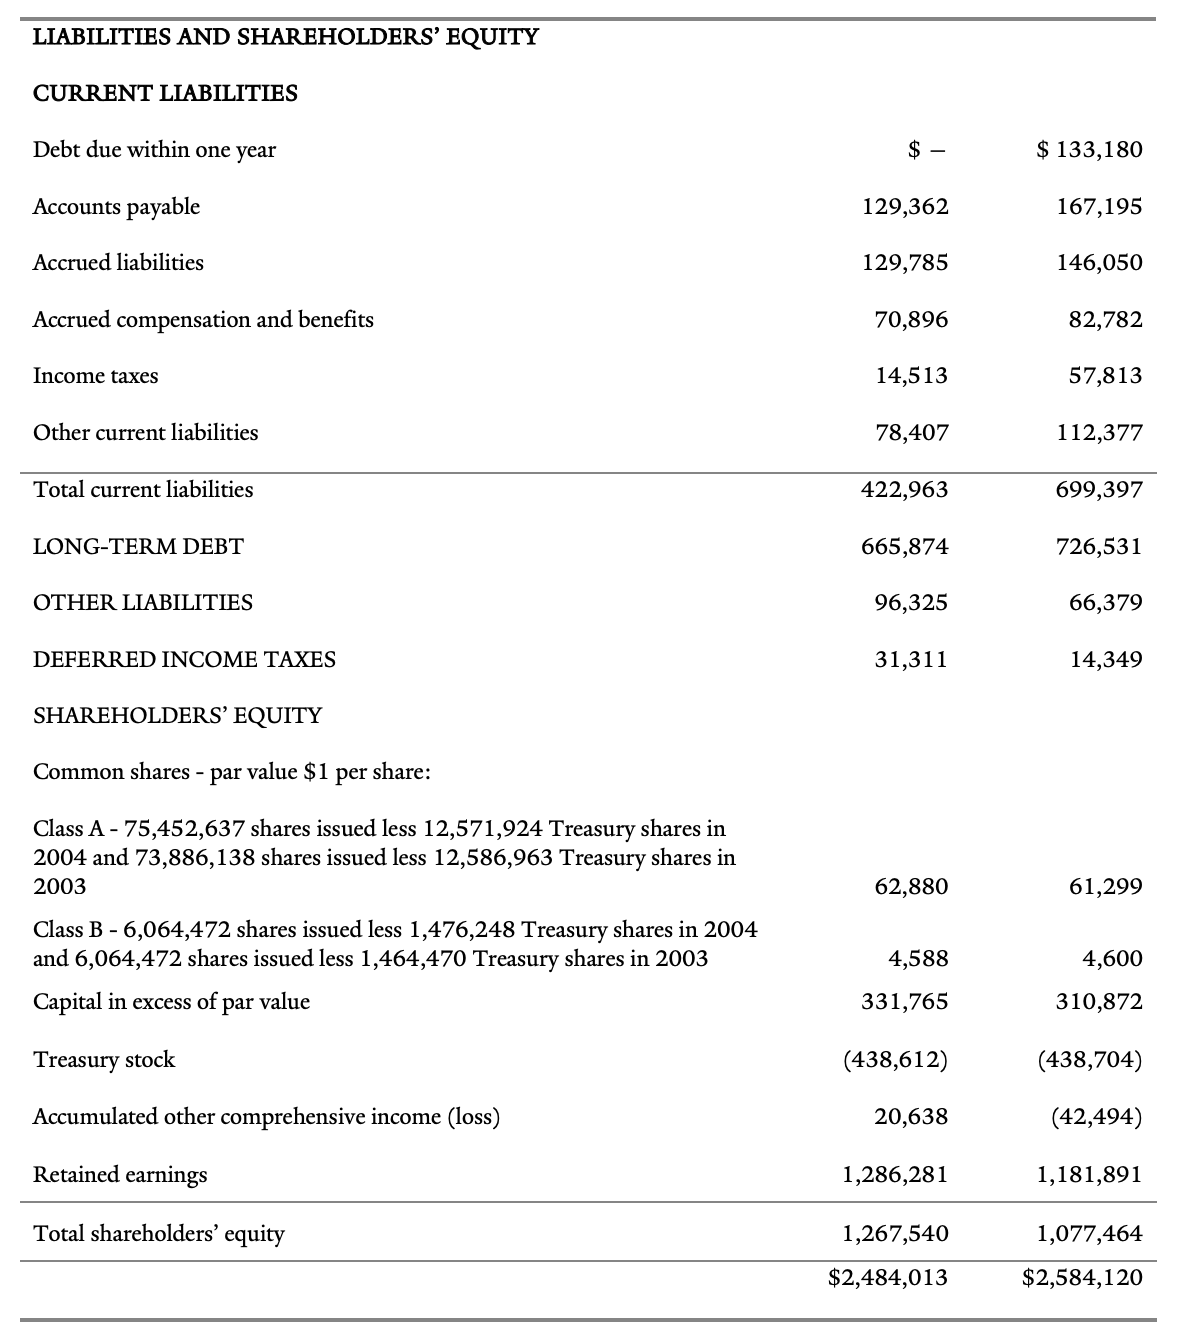
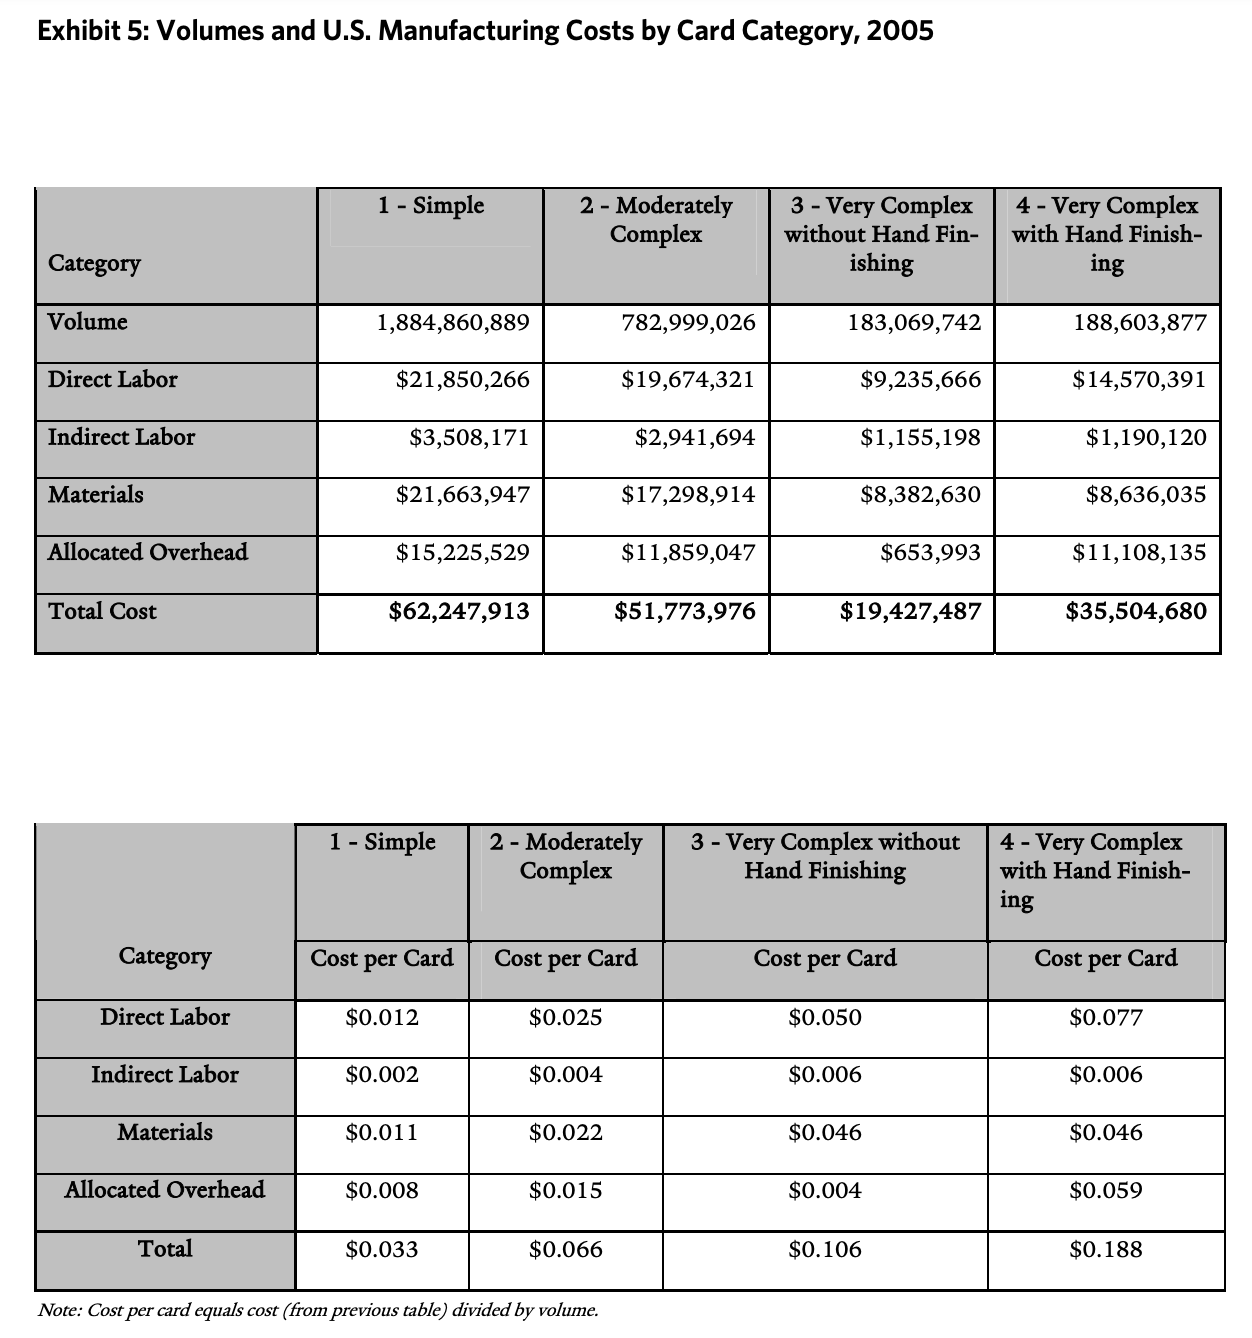
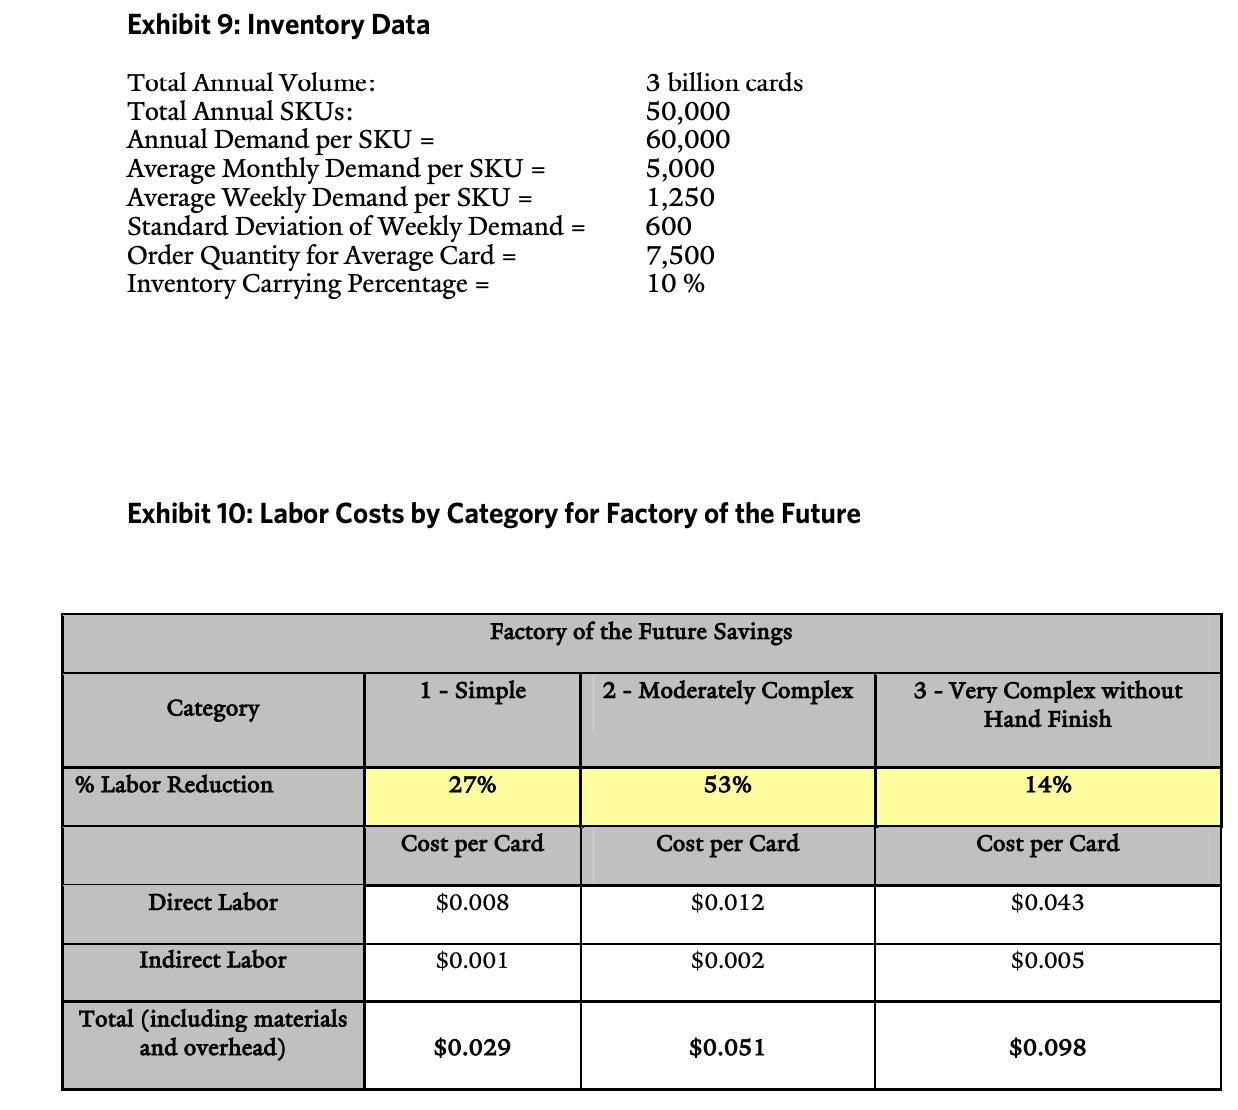
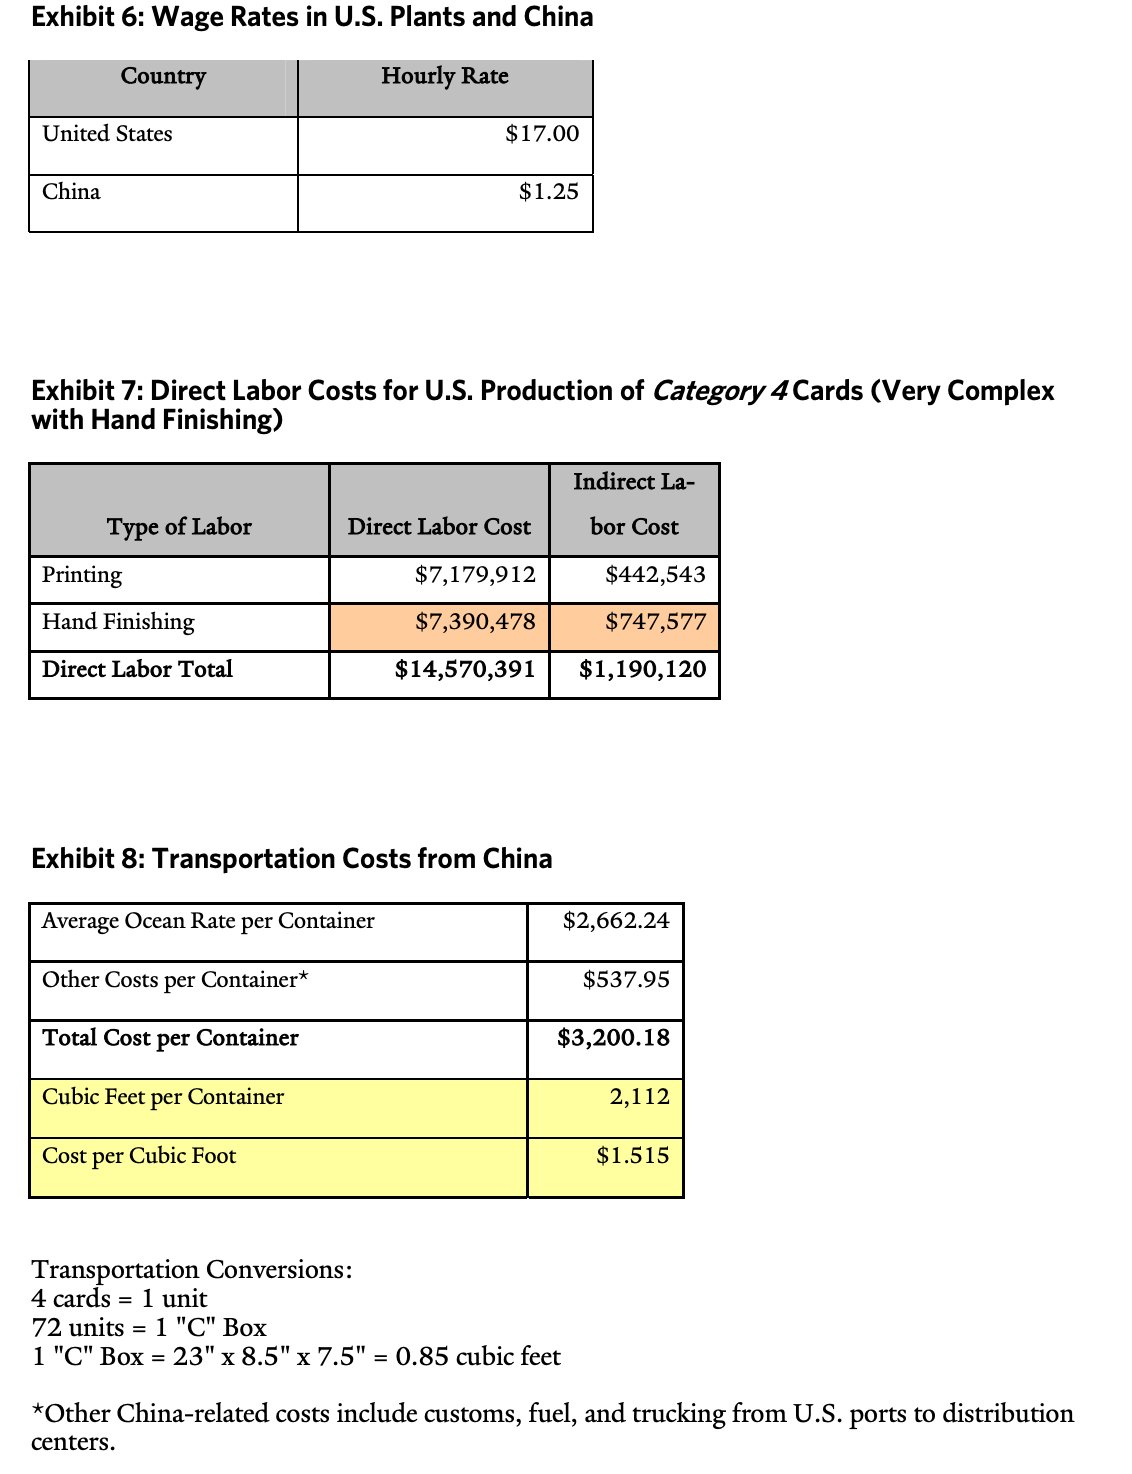
The Model In order to assess the risks and benets in more detail, American Greetings formed a Card Supply Strategy Team in March 2005. Members of the team were drawn from the manufacturing, global outsourcing, and nance divisions of the company. Goulder gave director of strategic operations Jason Shefrin responsibility for developing a detailed economic model to analyze alternative strategies. With an MBA from the University of Chicago, Shefrin was familiar with nancial analysis methods and inventory models. The rst option evaluated was the outsourcing of all seasonal cards to China. The team's analysis showed some signicant labor savings, but these benets were offset to some degree by the costs of transportation. In addition, there was the massive disruption that would happen during the transition, as well as the currency and political risks. There was also the downside associated with longer lead times and 10 AMERICAN GREETINGS YALE SCHOOL OF MANAGEMENT the loss of sheeting efciency for production that remained in the United States. The option of outsourcing seasonal cards appeared to be problematic. Outsourcing by Card Category Goulder then requested that detailed cost comparisons of outsourcing versus domestic automation be performed for all cards, both everyday and seasonal. These analyses were to be cut for each of the four main product categories: 1) simple inkonpaper cards; 2) moderately complex cards; 3) very complex cards without hand nishing; 4) very complex cards with hand nishing. These four types of cards required progressively greater labor to produce, the last having the highest labor content. In performing the costbenet analysis on the four categories, the base case was the current production in the US. before any improvements in process or technology. (See Exhibit 5 for annual card volumes as well as labor, material, and allocated overhead costs for each of the four categories in the base case.) Outsourcing for Category 4 Cards The Card Supply Strategy Team rst evaluated the economics of outsourcing cards in category 4. These were the most complex items that involved nishing operations that could best be done by hand, such as adding ribbons and other decorative attachments. Because of the immense variety of nishings required, investing in more automated technology was not a practical option for category 4. cards. After discussions with companies in China, the team estimated that the Chinese bid price for a category 4. card would be 15 cents per card. The Chinese bid price reected the fact that in the near term at least, productivity was expected to be much lower in Chinese plants compared to production in the US. This was true for category 4. production as well as for production of cards in categories 1 3. (See Exhibit 6 for wage rates in the United States and China. See Exhibit 7 for a breakdown of labor costs for printing and hand nishing for U.S. manufacturing of category 4 cards.) Outsourcing for Category 4 Cards The Card Supply Strategy Team rst evaluated the economics of outsourcing cards in category 4. These were the most complex items that involved nishing operations that could best be done by hand, such as adding ribbons and other decorative attachments. Because of the immense variety of nishings required, investing in more automated technology was not a practical option for category 4 cards. After discussions with companies in China, the team estimated that the Chinese bid price for a category 4 card would be 15 cents per card. The Chinese bid price reected the fact that in the near term at least, productivity was expected to be much lower in Chinese plants compared to production in the U.S. This was true for category 4 production as well as for production of cards in categories 1 - 3. (See Exhibit 6 for wage rates in the United States and China. See Exhibit 7 for a breakdown of labor costs for printing and hand nishing for U.S. manufacturing of category 4 cards.) Transportation, Lead Time, and Inventory Considerations After coming up with a basic per-card cost for outsourcing category 4 cards, the team wanted to factor in the impact of transportation costs, lead time, and inventory costs for outsourcing any of the categories of cards. The costs of shipping from China were straightforward. (See Exhibit 8 for transportation costs from China to the U.S.) The impact of outsourcing on lead time and inventory was more difcult to calculate. Total card production consisted of seasonal cards and everyday cards, with total volume across the four categories divided evenly between the two types. Outsourcing to China would only affect the inventory levels for everyday cards. Order quantities for seasonal cards were set well before the start of each seasonal campaign, and She'in believed the quantities would remain the same whether the cards were produced in China or in the U.S. Printing and hand nishing category 4 cards in China would add eight weeks to the average lead time. There was concern throughout the organization, particularly among manufacturing 11 AMERICAN GREETINGS YALE SCHOOL OF MANAGEMENT managers, about the impact on safety stock resulting from the much longer lead time required for product outsourced to China. For everyday cards American Greetings used an economic order quantity with uncertainty (Qbr) model to determine its order quantities and reorder points. For each SKU, it set the reorder point and therefore the safety stock by specifying a ll rate of 98 percent. In assessing the impact on safety stock, Shefrin treated the six-week domestic production lead time as constant, but he recognized that the estimated 14-week lead time from China was an average and that actual lead time might be longer because of bad weather, port problems, or other delays. He had no data on actual lead times from China and therefore had to make Exhibit 2: American Greetings Financial Data, 2004 Consolidated Statement of Operations, Years Ending February 29, 2004, and February 28, 2003, and 2002 Thousands of dollars except share and per share amounts 2004 2003 2002 Net sales $ 2,008,943 $ 1,995,860 $ 1,927,346 Costs and expenses: Material, labor and other production costs 937,619 881,771 937,001 Selling, distribution and marketing 649,679 620,885 685,942 Administrative and general 225,400 240,129 313,655 Restructure charges 56,715 Interest expense 85,828 79,095 78,599 Other (income) expense - net (60,334) (26,858) 51,758 1,838,192 1,795,022 2,123,670 Income (loss) before income tax expense (benefit) 170,751 200,838 (196,324) Income tax expense (benefit) 66,081 79,732 (74,014) Net income (loss) $ 104,670 $ 121,106 $ (122,310) Earnings (loss) per share $ 1.57 $ 1.85 $ (1.92) Earnings (loss) per share - assuming dilution $ 1.40 $ 1.63 $ (1.92) Average number of shares outstanding 66,509,332 65,636,621 63,615,193 Average number of shares outstanding - assuming dilution 80,088,377 78,980,830 63,615,193Consolidated Statement of Financial Position, February 29, 2004, and February 28, 2003 Thousands of dollars except share and per share amounts 2004 2003 ASSETS CURRENT ASSETS Cash and cash equivalents $ 285,450 $ 208,463 Trade accounts receivable, less allowances for sales returns of $85,638 ($86,318 in 2003) and for doubtful accounts of $18,183 ($35,595 in 2003) 250,554 309,967 Inventories 246,171 278,807 Deferred and refundable income taxes 158,689 202,485 Prepaid expenses and other 236,104 234,766 Total current assets 1,176,968 1,234,488 GOODWILL 228,955 209,664 OTHER ASSETS 708,957 748,540 PROPERTY, PLANT AND EQUIPMENT - NET 369,133 391,428 $2,484,013 $2,584,120LIABILITIES AND SHAREHOLDERS' EQUITY CURRENT LIABILITIES Debt due within one year $ $ 133,180 Accounts payable 129,362 167,195 Accrued liabilities 1 29, 78 5 146,050 Accrued compensation and benets 70,896 82,782 Income taxes 14,513 57,813 Other current liabilities 78,407 1 1 2 ,3 77 LONG-TERM DEBT 665,874 726,53 1 OTHER LIABILITIES 96,325 66,3 79 DEFERRED INCOME TAES 3 1 ,3 1 1 14,349 SHAREHOLDERS' EQUITY Common shares par value $ 1 per share: Class A 75,452,637 shares issued less 12,571,924 Treasury shares in 2004 and 73,886,138 shares issued less 12,586,963 Treasury shares in 2003 62,880 61,299 Class B - 6,064,472 shares issued less 1,476,248 Treasury shares in 2004 and 6,064,472 shares issued less 1 ,464,470 Treasury shares in 2003 4,588 4,600 Capital in excess of par value 33 1,765 3 10,872 Treasury stock (438,6 1 2) (438, 704) Accumulated other comprehensive income (loss) 20,638 (42,494) Retained earnings 1,286,281 1,181,891 Total shareholders' equity 1 ,267,540 1,077,464 $2,484,013 $2,584,120 Exhibit 5: Volumes and U.S. Manufacturing Costs by Card Category, 2005 1 - Simple 2 - Moderately 3 - Very Complex 4 - Very Complex Complex without Hand Fin- with Hand Finish- Category ishing ing Volume 1,884,860,889 782,999,026 183,069,742 188,603,877 Direct Labor $21,850,266 $19,674,321 $9,235,666 $14,570,391 Indirect Labor $3,508,171 $2,941,694 $1,155,198 $1,190,120 Materials $21,663,947 $17,298,914 $8,382,630 $8,636,035 Allocated Overhead $15,225,529 $11,859,047 $653,993 $11,108,135 Total Cost $62,247,913 $51,773,976 $19,427,487 $35,504,680 1 - Simple 2 - Moderately 3 - Very Complex without 4 - Very Complex Complex Hand Finishing with Hand Finish- ing Category Cost per Card Cost per Card Cost per Card Cost per Card Direct Labor $0.012 $0.025 $0.050 $0.077 Indirect Labor $0.002 $0.004 $0.006 $0.006 Materials $0.011 $0.022 $0.046 $0.046 Allocated Overhead 800 0$ $0.015 $0.004 $0.059 Total $0.033 $0.066 $0. 106 $0. 188 Note: Cost per card equals cost (from previous table) divided by volume.Exhibit 9: Inventory Data Total Annual Volume: 3 billion cards Total Annual SKUs: 50,000 Annual Demand per SKU = 60,000 Average Monthly Demand per SKU = 5,000 Average Weekly Demand per SKU = 1,250 Standard Deviation of Weekly Demand = 600 Order Quantity for Average Card = 7,500 Inventory Carrying Percentage = 10% Exhibit 10: Labor Costs by Category for Factory of the Future Factory of the Future Savings 1 - Simple 2 - Moderately Complex 3 - Very Complex without Category Hand Finish % Labor Reduction 27% 53% 14% Cost per Card Cost per Card Cost per Card Direct Labor $0.008 $0.012 $0.043 Indirect Labor $0.001 $0.002 $0.005 Total (including materials and overhead) $0.029 $0.051 $0.098Exhibit 6: Wage Rates in U.S. Plants and China Exhibit 7: Direct Labor Costs for U.S. Production of Categoryt! Cards (Very Complex with Hand Finishing) Direct Labor Total $14,570,391 $1,190,120 Exhibit 8: Transportation Costs from China Average Ocean Rate per Container Other Costs per Container* $537.95 Total Cost per Container $3,200.18 Cubic Feet per Container 2,1 12 Cost per Cubic Foot 55 1 .5 1 5 Transportation Conversions: 4 cards = 1 unit 72 units = 1 "C" Box 1 "C" Box = 23" x 8.5" x 7.5" = 0.85 cubic feet *Other China-related costs include customs, fuel, and trucking from U.S. ports to distribution centers
Step by Step Solution
There are 3 Steps involved in it

Get step-by-step solutions from verified subject matter experts