

Question: Please record the adjustments in the first two preformatted worksheets to the appropriate columns. 1 Purchased inventories of $460,000, on account, terms 2/15, n45. 2
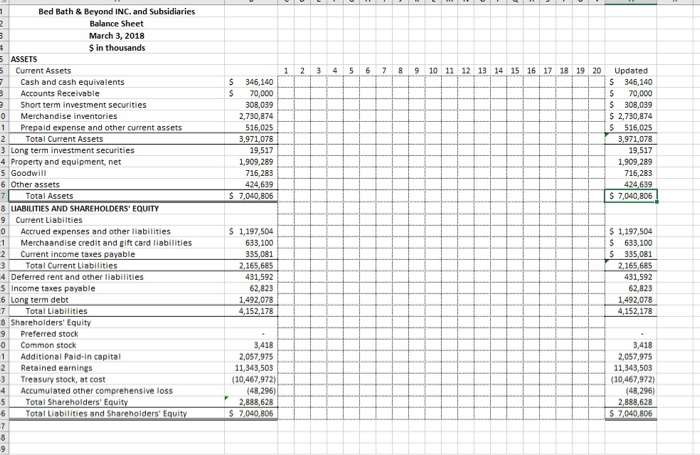
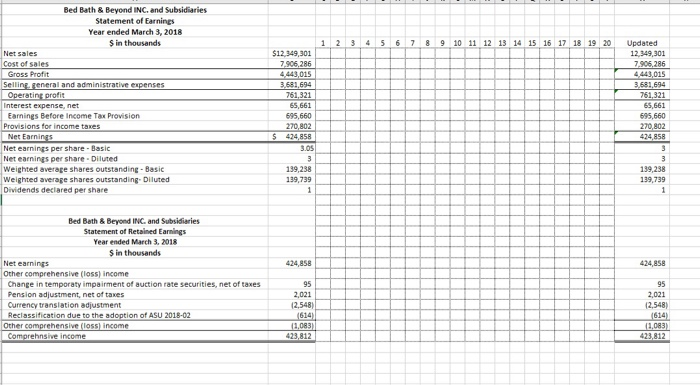
1 2 3 4 5 6 7 8 9 10 11 12 13 14 15 16 17 18 19 20 $ 346,140 70,000 308,039 2,730,874 516,025 3,971,078 19,517 1,909,289 716,283 424,639 $ 7,040,805 Updated $ 346,140 $ 70,000 $ 308,039 $ 2,730,874 $ 516,025 3,971,078 19,517 1,909,289 716,283 424.639 $ 7,040,806 1 Bed Bath & Beyond INC. and Subsidiaries 2 Balance Sheet 3 March 3, 2018 $ in thousands 5 ASSETS 5 Current Assets Cash and cash equivalents 3 Accounts Receivable Short term investment securities 0 Merchandise inventories 1 Prepaid expense and other current assets 2 Total Current Assets 3 Long term investment securities 4 Property and equipment, net 5 Goodwill 6 Other assets 7 Total Assets 8 LIABILITIES AND SHAREHOLDERS' EQUITY 9 Current Liabilties Accrued expenses and other liabilitie 1 Merchaandise credit and gift card liabilities 2 Current income taxes payable 3 Total Current Liabilities 4 Deferred rent and other liabilities 5 Income taxes payable 6 Long term debt -7 Total Liabilities 3 Shareholders' Equity 9 Preferred stock 0 Common stock Additional Paid.in capital 2 Retained earnings 3 Treasury stock, at cost 4 Accumulated other comprehensive loss 5 Total Shareholders' Equity 6 Total Liabilities and Shareholders' Equity -7 8 $ 1,197,504 633,100 335,081 2,165,685 431,592 62,823 1.492,078 4,152,178 $ 1,197,504 $ 633,100 $ 335,081 2,165,685 431,592 62,823 1.492.078 4,152,178 3,418 2,057,975 11,343,503 (10,467,972) (48,296) 2,888,628 $ 7,040,806 3,418 2,057,975 11,343,503 (10,467,972) (48,296) 2,888,628 $ 7,040,805 1 3 4 5 6 7 8 9 10 11 12 13 14 15 16 17 18 19 20 Bed Bath & Beyond INC. and Subsidiaries Statement of Earnings Year ended March 3, 2018 Sin thousands Net sales Cost of sales Gross Profit Selline peneral and administrative expenses Operating profit Interest expense, net Earnings Before Income Tax Provision Provisions for income taxes Net Earnings Net earnings per share - Basic Net earnings per share - Diluted Weighted average shares outstanding - Basic Weighted average shares outstanding. Diluted Dividends declared per share $12,349,301 7.906,286 4.443,015 3,681,694 761,321 65,661 695,660 270,802 S 424,858 3.05 3 139,238 139,739 1 Updated 12,349,301 7.905,286 4.443,015 3,581,694 761,321 65,661 695,660 270,802 424,858 3 3 139,238 139,739 1 424,858 424,858 Bed Bath & Beyond INC. and Subsidiaries Statement of Retained Earnings Year ended March 3, 2018 $ in thousands Net earnings Other comprehensive (loss) income Change in temporaty impairment of auction rate securities, net of taxes Pension adjustment, net of taxes Currency translation adjustment Reclassification due to the adoption of ASU 2018-02 Other comprehensive (loss) income Comprehnsive income 95 2,021 (2,548 (614) (1,083) 423,812 95 2,021 12,548 614) (1,083 423812 1 2 3 4 5 6 7 8 9 10 11 12 13 14 15 16 17 18 19 20 $ 346,140 70,000 308,039 2,730,874 516,025 3,971,078 19,517 1,909,289 716,283 424,639 $ 7,040,805 Updated $ 346,140 $ 70,000 $ 308,039 $ 2,730,874 $ 516,025 3,971,078 19,517 1,909,289 716,283 424.639 $ 7,040,806 1 Bed Bath & Beyond INC. and Subsidiaries 2 Balance Sheet 3 March 3, 2018 $ in thousands 5 ASSETS 5 Current Assets Cash and cash equivalents 3 Accounts Receivable Short term investment securities 0 Merchandise inventories 1 Prepaid expense and other current assets 2 Total Current Assets 3 Long term investment securities 4 Property and equipment, net 5 Goodwill 6 Other assets 7 Total Assets 8 LIABILITIES AND SHAREHOLDERS' EQUITY 9 Current Liabilties Accrued expenses and other liabilitie 1 Merchaandise credit and gift card liabilities 2 Current income taxes payable 3 Total Current Liabilities 4 Deferred rent and other liabilities 5 Income taxes payable 6 Long term debt -7 Total Liabilities 3 Shareholders' Equity 9 Preferred stock 0 Common stock Additional Paid.in capital 2 Retained earnings 3 Treasury stock, at cost 4 Accumulated other comprehensive loss 5 Total Shareholders' Equity 6 Total Liabilities and Shareholders' Equity -7 8 $ 1,197,504 633,100 335,081 2,165,685 431,592 62,823 1.492,078 4,152,178 $ 1,197,504 $ 633,100 $ 335,081 2,165,685 431,592 62,823 1.492.078 4,152,178 3,418 2,057,975 11,343,503 (10,467,972) (48,296) 2,888,628 $ 7,040,806 3,418 2,057,975 11,343,503 (10,467,972) (48,296) 2,888,628 $ 7,040,805 1 3 4 5 6 7 8 9 10 11 12 13 14 15 16 17 18 19 20 Bed Bath & Beyond INC. and Subsidiaries Statement of Earnings Year ended March 3, 2018 Sin thousands Net sales Cost of sales Gross Profit Selline peneral and administrative expenses Operating profit Interest expense, net Earnings Before Income Tax Provision Provisions for income taxes Net Earnings Net earnings per share - Basic Net earnings per share - Diluted Weighted average shares outstanding - Basic Weighted average shares outstanding. Diluted Dividends declared per share $12,349,301 7.906,286 4.443,015 3,681,694 761,321 65,661 695,660 270,802 S 424,858 3.05 3 139,238 139,739 1 Updated 12,349,301 7.905,286 4.443,015 3,581,694 761,321 65,661 695,660 270,802 424,858 3 3 139,238 139,739 1 424,858 424,858 Bed Bath & Beyond INC. and Subsidiaries Statement of Retained Earnings Year ended March 3, 2018 $ in thousands Net earnings Other comprehensive (loss) income Change in temporaty impairment of auction rate securities, net of taxes Pension adjustment, net of taxes Currency translation adjustment Reclassification due to the adoption of ASU 2018-02 Other comprehensive (loss) income Comprehnsive income 95 2,021 (2,548 (614) (1,083) 423,812 95 2,021 12,548 614) (1,083 423812
Step by Step Solution
There are 3 Steps involved in it

Get step-by-step solutions from verified subject matter experts