

Question: Please recreate excel spreadsheet with all formulas in place. Formulas are below. As Reported Annual Income Statement Report Date 04/30/2021 04/30/2020 04/30/2019 04/30/2018 04/30/2017 Scale
Please recreate excel spreadsheet with all formulas in place. Formulas are below.
| As Reported Annual Income Statement | ||||||
| Report Date | 04/30/2021 | 04/30/2020 | 04/30/2019 | 04/30/2018 | 04/30/2017 | |
| Scale | Thousands | Thousands | Thousands | Thousands | Thousands | |
| Net sales | $ 8,002,700 | $ 7,801,000 | $ 7,838,000 | $ 7,357,100 | $ 7,392,300 | |
| Cost of products sold | 4,864,000 | 4,799,000 | 4,922,300 | 4,521,000 | 4,557,000 | |
| Gross profit | $ 3,138,700 | $ 3,002,000 | $ 2,915,700 | $ 2,836,100 | $ 2,835,300 | |
| Selling, distribution & administrative expenses | 1,523,100 | 1,474,300 | 1,508,600 | 1,370,800 | 1,390,700 | |
| Amortization | 233,000 | 236,300 | 240,300 | 206,800 | 207,300 | |
| Goodwill impairment charge | 0 | 0 | 97,900 | 145,000 | 0 | |
| Other intangible assets impairment charges | 3,800 | 52,400 | 107,200 | 31,900 | 133,200 | |
| Other special project costs | 20,700 | 16,500 | 64,100 | 45,400 | 76,900 | |
| Other operating expense (income) - net | (28,700) | (600) | (31,000) | 100 | (4,300) | |
| Operating income | $ 1,386,800 | $ 1,223,100 | $ 928,600 | $ 1,036,100 | $ 1,031,500 | |
| Interest expense - net | 177,100 | 189,200 | 207,900 | 174,100 | 163,100 | |
| Other income (expense) - net | (37,800) | (7,200) | (19,100) | (1,000) | 10,000 | |
| Income tax expense (benefit) | 295,600 | 247,200 | 187,200 | (477,600) | 286,100 | |
| Net income | $ 876,300 | $ 779,500 | $ 514,400 | $ 1,338,600 | $ 592,300 | |
| Weighted average shares outstanding - basic | 112,000 | 113,400 | 113,100 | 113,000 | 115,471 | |
| Weighted average shares outstanding - diluted | 112,000 | 113,400 | 113,100 | 113,000 | 115,578 | |
| Year end shares outstanding | 108,339 | 114,073 | 113,742 | 113,573 | 113,440 | |
| Net earnings (loss) per common share - basic | $7.79 | $6.84 | $4.52 | $11.79 | $5.11 | |
| Net earnings (loss) per common share - assuming dilution | $7.79 | $6.84 | $4.52 | $11.78 | $5.10 | |
| Dividends declared per common share | $3.60 | $3.52 | $3.40 | $3.12 | $3.00 | |
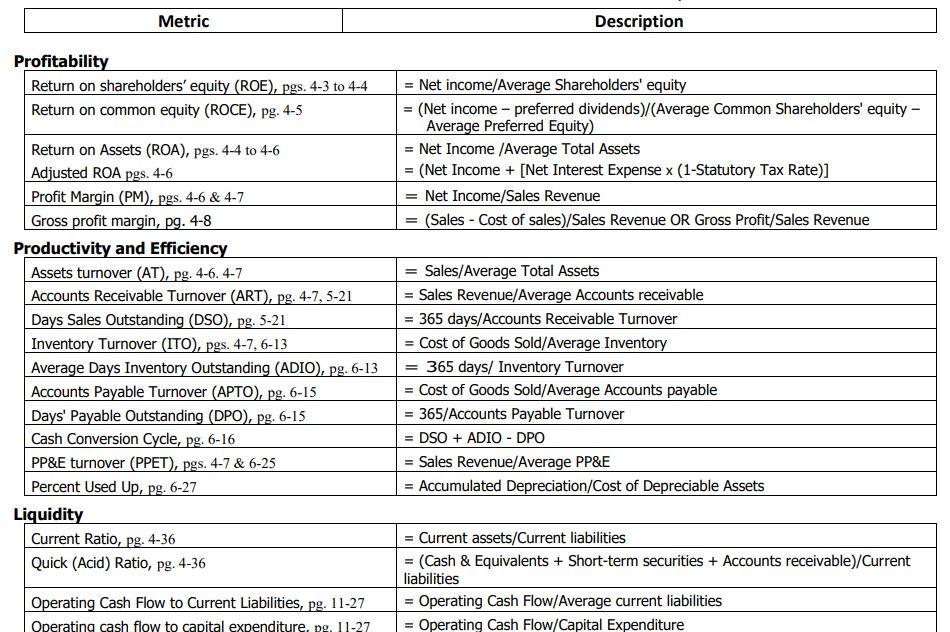
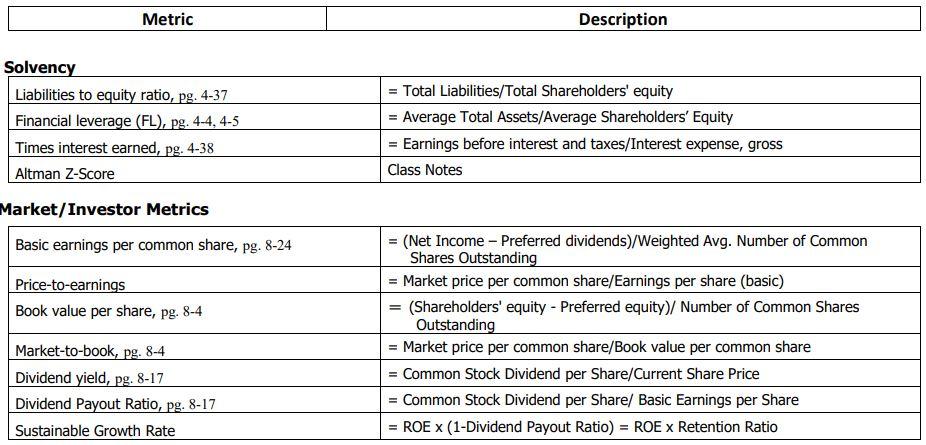
Metric Description Profitability Return on shareholders' equity (ROE), pgs. 4-3 to 4-4 Return on common equity (ROCE), pg. 4-5 Net income/Average Shareholders' equity = (Net income - preferred dividends) (Average Common Shareholders' equity - Average Preferred Equity) = Net Income /Average Total Assets = (Net Income + [Net Interest Expense x (1-Statutory Tax Rate)] Net Income/Sales Revenue (Sales - Cost of sales)/Sales Revenue OR Gross Profit/Sales Revenue = = Return on Assets (ROA), Pgs. 4-4 to 4-6 Adjusted ROA pgs. 4-6 Profit Margin (PM), pgs. 4-6 & 4-7 Gross profit margin, pg. 4-8 Productivity and Efficiency Assets turnover (AT), pg. 4-6. 4-7 Accounts Receivable Turnover (ART), pg. 4-7, 5-21 Days Sales Outstanding (DSO), pg. 5-21 Inventory Turnover (ITO), pgs. 4-7, 6-13 Average Days Inventory Outstanding (ADIO), Pg. 6-13 Accounts Payable Turnover (APTO), pg. 6-15 Days' Payable Outstanding (DPO), pg. 6-15 Cash Conversion Cycle, pg. 6-16 PP&E turnover (PPET), pgs. 4-7 & 6-25 Percent Used Up, pg. 6-27 Liquidity Current Ratio, pg. 4-36 Quick (Acid) Ratio, pg.4-36 = Sales/Average Total Assets Sales Revenue/Average Accounts receivable = 365 days/Accounts Receivable Turnover = Cost of Goods Sold/Average Inventory 365 days/ Inventory Turnover = Cost of Goods Sold/Average Accounts payable 365/Accounts Payable Turnover DSO + ADIO - DPO - Sales Revenue/Average PP&E = Accumulated Depreciation/Cost of Depreciable Assets = - = Current assets/Current liabilities (Cash & Equivalents + Short-term securities + Accounts receivable)/Current liabilities Operating Cash Flow/Average current liabilities Operating Cash Flow/Capital Expenditure Operating Cash Flow to Current Liabilities, pg. 11-27 Operating cash flow to capital expenditure, pg. 11-27 Metric Description Solvency Liabilities to equity ratio, pg. 4-37 Financial leverage (FL), pg. 4-4, 4-5 Times interest earned, pg. 4-38 Altman Z-Score Market/Investor Metrics = Total Liabilities/Total Shareholders' equity = Average Total Assets/Average Shareholders' Equity = Earnings before interest and taxes/Interest expense, gross Class Notes = Basic earnings per common share, pg. 8-24 Price-to-earnings Book value per share, pg. 8-4 = (Net Income - Preferred dividends)/Weighted Avg. Number of Common Shares Outstanding = Market price per common share/Earnings per share (basic) (Shareholders' equity - Preferred equity)/ Number of Common Shares Outstanding Market price per common share/Book value per common share = Common Stock Dividend per Share/Current Share Price Common Stock Dividend per Share/ Basic Earnings per Share ROEX (1-Dividend Payout Ratio) = ROE x Retention Ratio - Market-to-book, pg. 8-4 Dividend yield, pg. 8-17 Dividend Payout Ratio, pg. 8-17 Sustainable Growth Rate - - Metric Description Profitability Return on shareholders' equity (ROE), pgs. 4-3 to 4-4 Return on common equity (ROCE), pg. 4-5 Net income/Average Shareholders' equity = (Net income - preferred dividends) (Average Common Shareholders' equity - Average Preferred Equity) = Net Income /Average Total Assets = (Net Income + [Net Interest Expense x (1-Statutory Tax Rate)] Net Income/Sales Revenue (Sales - Cost of sales)/Sales Revenue OR Gross Profit/Sales Revenue = = Return on Assets (ROA), Pgs. 4-4 to 4-6 Adjusted ROA pgs. 4-6 Profit Margin (PM), pgs. 4-6 & 4-7 Gross profit margin, pg. 4-8 Productivity and Efficiency Assets turnover (AT), pg. 4-6. 4-7 Accounts Receivable Turnover (ART), pg. 4-7, 5-21 Days Sales Outstanding (DSO), pg. 5-21 Inventory Turnover (ITO), pgs. 4-7, 6-13 Average Days Inventory Outstanding (ADIO), Pg. 6-13 Accounts Payable Turnover (APTO), pg. 6-15 Days' Payable Outstanding (DPO), pg. 6-15 Cash Conversion Cycle, pg. 6-16 PP&E turnover (PPET), pgs. 4-7 & 6-25 Percent Used Up, pg. 6-27 Liquidity Current Ratio, pg. 4-36 Quick (Acid) Ratio, pg.4-36 = Sales/Average Total Assets Sales Revenue/Average Accounts receivable = 365 days/Accounts Receivable Turnover = Cost of Goods Sold/Average Inventory 365 days/ Inventory Turnover = Cost of Goods Sold/Average Accounts payable 365/Accounts Payable Turnover DSO + ADIO - DPO - Sales Revenue/Average PP&E = Accumulated Depreciation/Cost of Depreciable Assets = - = Current assets/Current liabilities (Cash & Equivalents + Short-term securities + Accounts receivable)/Current liabilities Operating Cash Flow/Average current liabilities Operating Cash Flow/Capital Expenditure Operating Cash Flow to Current Liabilities, pg. 11-27 Operating cash flow to capital expenditure, pg. 11-27 Metric Description Solvency Liabilities to equity ratio, pg. 4-37 Financial leverage (FL), pg. 4-4, 4-5 Times interest earned, pg. 4-38 Altman Z-Score Market/Investor Metrics = Total Liabilities/Total Shareholders' equity = Average Total Assets/Average Shareholders' Equity = Earnings before interest and taxes/Interest expense, gross Class Notes = Basic earnings per common share, pg. 8-24 Price-to-earnings Book value per share, pg. 8-4 = (Net Income - Preferred dividends)/Weighted Avg. Number of Common Shares Outstanding = Market price per common share/Earnings per share (basic) (Shareholders' equity - Preferred equity)/ Number of Common Shares Outstanding Market price per common share/Book value per common share = Common Stock Dividend per Share/Current Share Price Common Stock Dividend per Share/ Basic Earnings per Share ROEX (1-Dividend Payout Ratio) = ROE x Retention Ratio - Market-to-book, pg. 8-4 Dividend yield, pg. 8-17 Dividend Payout Ratio, pg. 8-17 Sustainable Growth Rate
Step by Step Solution
There are 3 Steps involved in it

Get step-by-step solutions from verified subject matter experts