

Question: Please refer below for column names. 1) Except for 2019, there are 12 rows per year in the weather data because we have monthly weather
Please refer below for column names.
1) Except for 2019, there are 12 rows per year in the weather data because we have monthly weather measurements.
Find the average rainfall per year using SQL, except for 2019.
sql_statement = """...""" weather_results = pd.read_sql_query(sql_statement, conn) weather_results
2) Select all the rows where the Tmin and Tmax are within 4.5 degrees celsius of each other. Show the Year, Month, Tmin, and Tmax.
sql_statement = """...""" weather_results = pd.read_sql_query(sql_statement, conn) weather_results
3) Like the U.S., the summer months in London are June, July, and August.
Find the years where the average Tmax during the summer months is greater than the average overall summer Tmax. Show the average/Max/Min Tmax for these years.
sql_statement = """...""" weather_results = pd.read_sql_query(sql_statement, conn) weather_results
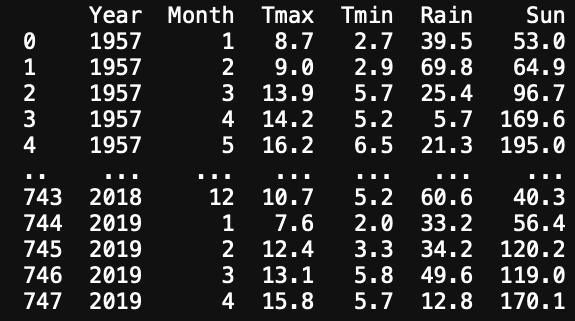
Year Month Tmax Tmin Rain Sun 0 1957 1 8.7 2.7 39.5 53.0 1 1957 2 9.0 2.9 69.8 64.9 234 1957 3 13.9 5.7 25.4 96.7 1957 4 14.2 5.2 5.7 169.6 4 1957 5 16.2 6.5 21.3 195.0 743 2018 12 10.7 5.2 60.6 40.3 744 2019 1 7.6 2.0 33.2 56.4 745 2019 2 12.4 3.3 34.2 120.2 746 2019 747 2019 3 13.1 5.8 49.6 119.0 4 15.8 5.7 12.8 170.1
Step by Step Solution
There are 3 Steps involved in it
Lets work through each of the SQL queries one by one 1 To calculate the average rainfall per year ex... View full answer

Get step-by-step solutions from verified subject matter experts