

Question: please reply fast DATA SHEET Record all of your data with the appropriate number of digits and the correct units. Standard Solutions: Mass H2O Mass
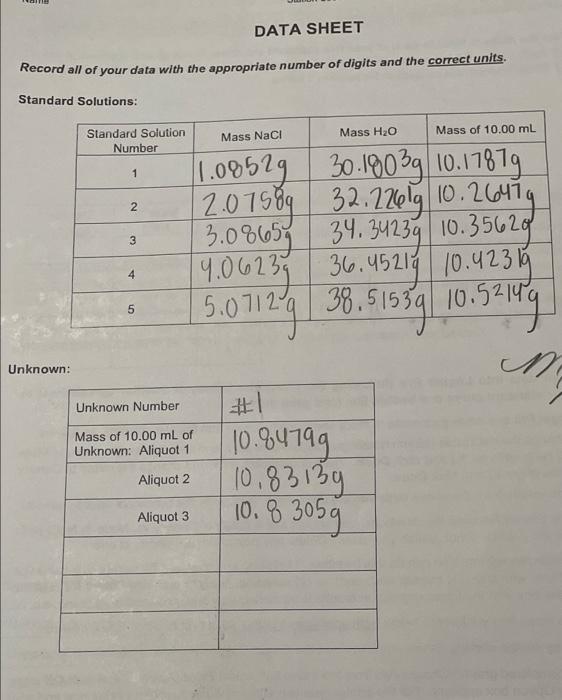
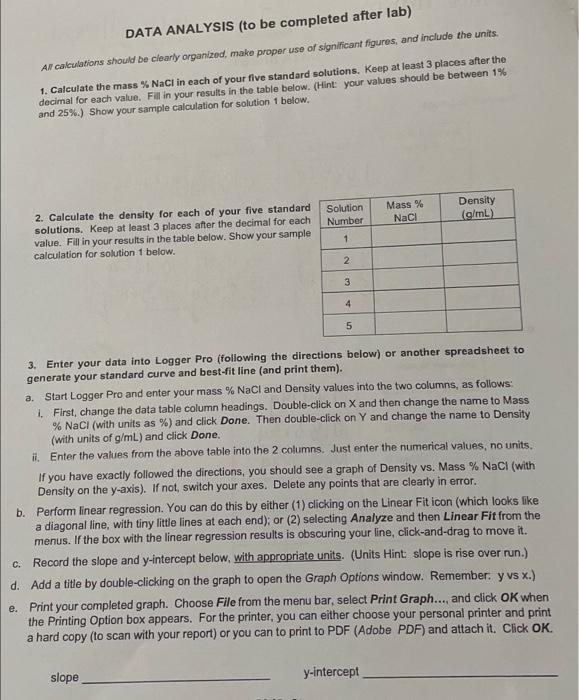
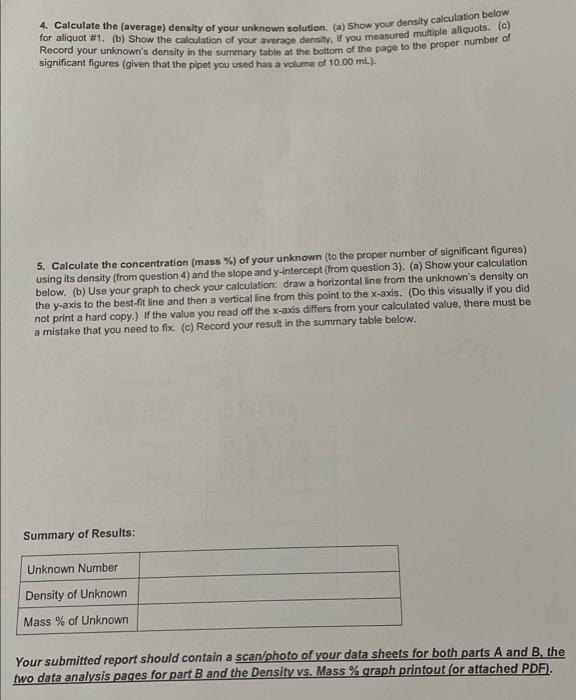
DATA SHEET Record all of your data with the appropriate number of digits and the correct units. Standard Solutions: Mass H2O Mass of 10.00 mL Standard Solution Number Mass Naci 1 N 1.08529 30.1903g 10.17879 2.07589 32.22601910.26474 34.34239 10.35620 19.06239 36.45214 10.423 15 5.07129 38.51539 10.52149 3.08657 3 4 5 Unknown: M Unknown Number #1 10.94199 Mass of 10.00 mL of Unknown: Aliquot 1 Aliquot 2 10.83139 10.8 3059 Aliquot 3 DATA ANALYSIS (to be completed after lab) Al calculations should be clearly organized, make proper use of significant figures, and include the units. 1. Calculate the mass % NaCl in each of your five standard solutions. Keep at least 3 places after the decimal for each value. Fill in your results in the table below. (Hint: your values should be between 1% and 25%.) Show your sample calculation for solution 1 below. Mass % NaCl Density (g/mL) 2. Calculate the density for each of your five standard solutions. Keep at least 3 places after the decimal for each value. Fill in your results in the table below. Show your sample calculation for solution 1 below. Solution Number 1 2 3 4 5 a. 3. Enter your data into Logger Pro (following the directions below) or another spreadsheet to generate your standard curve and best-fit line (and print them). Start Logger Pro and enter your mass % NaCl and Density values into the two columns, as follows: 1. First, change the data table column headings. Double-click on X and then change the name to Mass % NaCl (with units as %) and click Done. Then double-click on Y and change the name to Density (with units of g/mL) and click Done. it Enter the values from the above table into the 2 columns. Just enter the numerical values, no units. If you have exactly followed the directions, you should see a graph of Density vs. Mass % NaCl (with Density on the y-axis). If not, switch your axes. Delete any points that are clearly in error. b. Perform linear regression. You can do this by either (1) clicking on the Linear Fit icon (which looks like a diagonal line, with tiny little lines at each end); or (2) selecting Analyze and then Linear Fit from the menus. If the box with the linear regression results is obscuring your line, click-and-drag to move it. C. Record the slope and y-intercept below, with appropriate units. (Units Hint slope is rise over run.) d. Add a title by double-clicking on the graph to open the Graph Options window. Remember y vs x.) e. Print your completed graph. Choose File from the menu bar, select Print Graph..., and click OK when the Printing Option box appears. For the printer, you can either choose your personal printer and print a hard copy (to scan with your report) or you can to print to PDF (Adobe PDF) and attach it. Click OK. slope y-intercept 4. Calculate the (average) density of your unknown solution. (a) Show your density calculation below for aliquot 81. (b) Show the calculation of your average density. If you measured multiple aliquots. (c) Record your unknown's density in the summary table at the bottom of the page to the proper number of significant figures (given that the pipet you used has a volume of 10.00 mL). 5. Calculate the concentration (mass %) of your unknown (to the proper number of significant figures) using its density (from question 4) and the slope and y-intercept (from question 3). (a) Show your calculation below. (b) Use your graph to check your calculation: draw a horizontal line from the unknown's density on the y-axis to the best-fit line and then a vertical line from this point to the x-axis. (Do this visually if you did not print a hard copy.) If the value you read off the x-axis differs from your calculated value, there must be a mistake that you need to fix. (c) Record your result in the summary table below. Summary of Results: Unknown Number Density of Unknown Mass % of Unknown Your submitted report should contain a scan/photo of your data sheets for both parts A and B the two data analysis pages for part B and the Density vs. Mass % graph printout (or attached PDF)
Step by Step Solution
There are 3 Steps involved in it

Get step-by-step solutions from verified subject matter experts