

Question: PLEASE RESPOND COMPLETE ANSWER I WILL RATE Problem #2: Data processing In this problem, you will be working with a sample of data recorded from
PLEASE RESPOND COMPLETE ANSWER I WILL RATE
Problem #2: Data processing
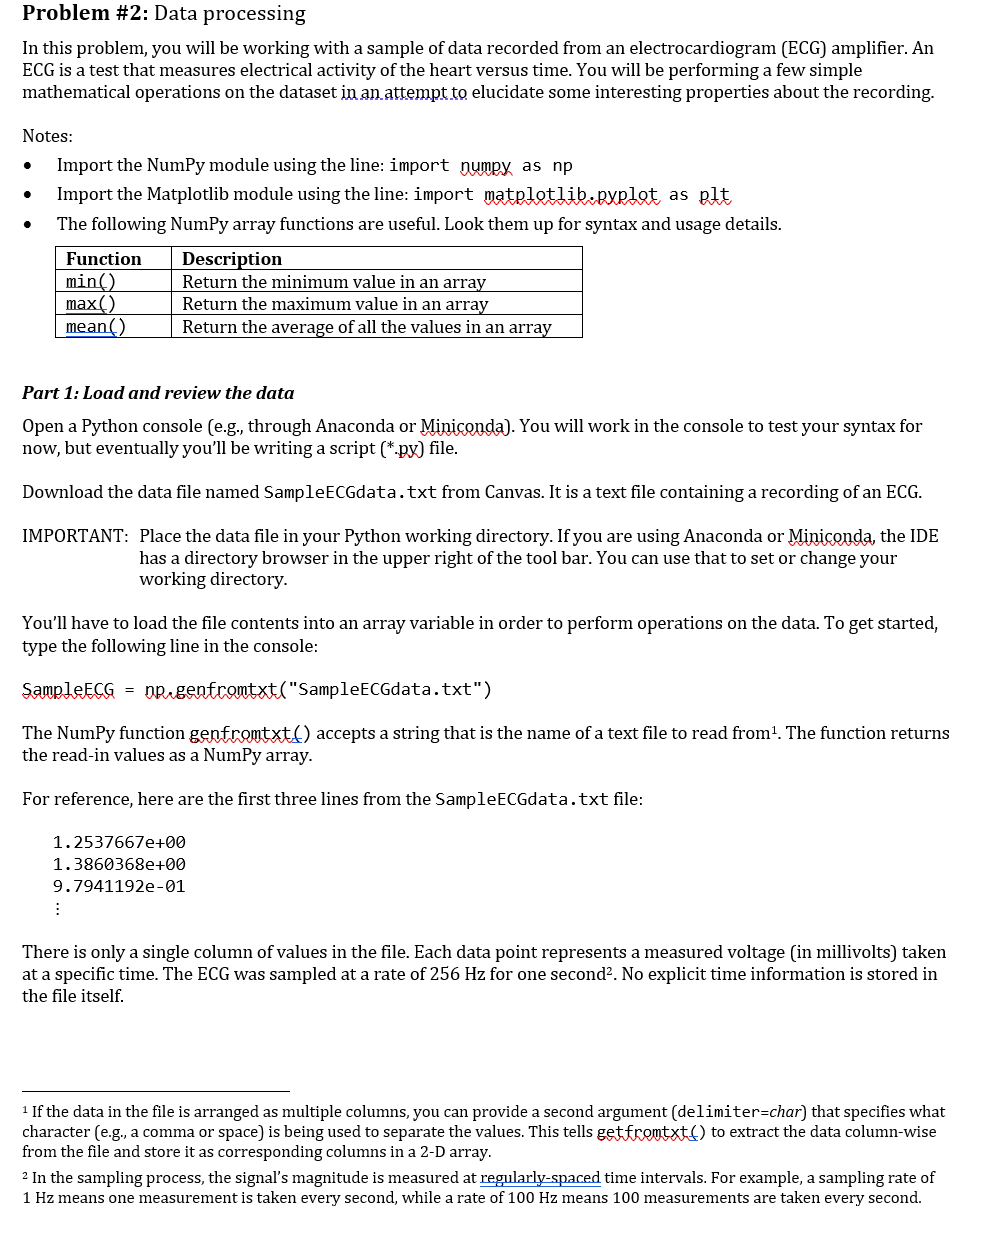
In this problem, you will be working with a sample of data recorded from an electrocardiogram (ECG) amplifier. An ECG is a test that measures electrical activity of the heart versus time. You will be performing a few simple mathematical operations on the dataset in an attempt to elucidate some interesting properties about the recording.
Notes:
- Import the NumPy module using the line: import numpy as np
- Import the Matplotlib module using the line: import matplotlib.pyplot as plt
- The following NumPy array functions are useful. Look them up for syntax and usage details.
| Function | Description |
| min() | Return the minimum value in an array |
| max() | Return the maximum value in an array |
| mean() | Return the average of all the values in an array |
Part 1: Load and review the data
Open a Python console (e.g., through Anaconda or Miniconda). You will work in the console to test your syntax for now, but eventually youll be writing a script (*.py) file.
Download the data file named SampleECGdata.txt from Canvas. It is a text file containing a recording of an ECG.
IMPORTANT: Place the data file in your Python working directory. If you are using Anaconda or Miniconda, the IDE has a directory browser in the upper right of the tool bar. You can use that to set or change your working directory.
Youll have to load the file contents into an array variable in order to perform operations on the data. To get started, type the following line in the console:
SampleECG = np.genfromtxt("SampleECGdata.txt")
The NumPy function genfromtxt() accepts a string that is the name of a text file to read from[1]. The function returns the read-in values as a NumPy array.
For reference, here are the first three lines from the SampleECGdata.txt file:
1.2537667e+00
1.3860368e+00
9.7941192e-01
There is only a single column of values in the file. Each data point represents a measured voltage (in millivolts) taken at a specific time. The ECG was sampled at a rate of 256 Hz for one second[2]. No explicit time information is stored in the file itself.
[1] If the data in the file is arranged as multiple columns, you can provide a second argument (delimiter=char) that specifies what character (e.g., a comma or space) is being used to separate the values. This tells getfromtxt() to extract the data column-wise from the file and store it as corresponding columns in a 2-D array.
[2] In the sampling process, the signals magnitude is measured at regularly-spaced time intervals. For example, a sampling rate of 1 Hz means one measurement is taken every second, while a rate of 100 Hz means 100 measurements are taken every second.
Once the data is loaded into the 1-D array variable, try these things in the console:
- What is the single line of Python code you can use to find the data type of the values in the array?
|
|
- Using your result from Part (a), what is the formal data type of the SampleECG values?
|
|
- What is the single line of Python code you can use to find the length of the array?
|
|
Note: If you are using Anaconda or Miniconda, the IDE window has a Variable Explorer that shows attributes of active variables in your workspace.
- What is the maximum value found in the SampleECG array?
|
|
- At what array index is the maximum value located within SampleECG? Hint: Look up the NumPy function argmax().
|
|

Problem #2: Data processing In this problem, you will be working with a sample of data recorded from an electrocardiogram (ECG) amplifier. An ECG is a test that measures electrical activity of the heart versus time. You will be performing a few simple mathematical operations on the dataset in an attempt to elucidate some interesting properties about the recording. . . Notes: Import the NumPy module using the line: import numpy as np Import the Matplotlib module using the line: import matpletlib.pyplet as oft The following NumPy array functions are useful. Look them up for syntax and usage details. Function Description min() Return the minimum value in an array max() Return the maximum value in an array mean() Return the average of all the values in an array Part 1: Load and review the data Open a Python console (e.g., through Anaconda or Miniconda). You will work in the console to test your syntax for now, but eventually you'll be writing a script (*.px) file. Download the data file named SampleECGdata.txt from Canvas. It is a text file containing a recording of an ECG. IMPORTANT: Place the data file in your Python working directory. If you are using Anaconda or Miniconda, the IDE has a directory browser in the upper right of the tool bar. You can use that to set or change your working directory. You'll have to load the file contents into an array variable in order to perform operations on the data. To get started, type the following line in the console: Sample ECG = nprgenfromtxt("Sample ECGdata.txt") The NumPy function genfromtxt) accepts a string that is the name of a text file to read from? The function returns the read-in values as a NumPy array. For reference, here are the first three lines from the SampleECGdata.txt file: 1.2537667e+00 1.3860368e+00 9.7941192e-01 : There is only a single column of values in the file. Each data point represents a measured voltage (in millivolts) taken at a specific time. The ECG was sampled at a rate of 256 Hz for one second?. No explicit time information is stored in the file itself. 1 If the data in the file is arranged as multiple columns, you can provide a second argument (delimiter=char) that specifies what character (e.g., a comma or space) is being used to separate the values. This tells get fromtxt) to extract the data column-wise from the file and store it as corresponding columns in a 2-D array. 2 In the sampling process, the signal's magnitude is measured at regularly-spaced time intervals. For example, a sampling rate of 1 Hz means one measurement is taken every second, while a rate of 100 Hz means 100 measurements are taken every second. Once the data is loaded into the 1-D array variable, try these things in the console: a) What is the single line of Python code you can use to find the data type of the values in the array? b) Using your result from Part (a), what is the formal data type of the Sample ECG values? c) What is the single line of Python code you can use to find the length of the array? Note: If you are using Anaconda or Miniconda, the IDE window has a Variable Explorer that shows attributes of active variables in your workspace. d) What is the maximum value found in the Sample ECG array? e) At what array index is the maximum value located within Sample ECG? Hint: Look up the NumPy function argmax(). Problem #2: Data processing In this problem, you will be working with a sample of data recorded from an electrocardiogram (ECG) amplifier. An ECG is a test that measures electrical activity of the heart versus time. You will be performing a few simple mathematical operations on the dataset in an attempt to elucidate some interesting properties about the recording. . . Notes: Import the NumPy module using the line: import numpy as np Import the Matplotlib module using the line: import matpletlib.pyplet as oft The following NumPy array functions are useful. Look them up for syntax and usage details. Function Description min() Return the minimum value in an array max() Return the maximum value in an array mean() Return the average of all the values in an array Part 1: Load and review the data Open a Python console (e.g., through Anaconda or Miniconda). You will work in the console to test your syntax for now, but eventually you'll be writing a script (*.px) file. Download the data file named SampleECGdata.txt from Canvas. It is a text file containing a recording of an ECG. IMPORTANT: Place the data file in your Python working directory. If you are using Anaconda or Miniconda, the IDE has a directory browser in the upper right of the tool bar. You can use that to set or change your working directory. You'll have to load the file contents into an array variable in order to perform operations on the data. To get started, type the following line in the console: Sample ECG = nprgenfromtxt("Sample ECGdata.txt") The NumPy function genfromtxt) accepts a string that is the name of a text file to read from? The function returns the read-in values as a NumPy array. For reference, here are the first three lines from the SampleECGdata.txt file: 1.2537667e+00 1.3860368e+00 9.7941192e-01 : There is only a single column of values in the file. Each data point represents a measured voltage (in millivolts) taken at a specific time. The ECG was sampled at a rate of 256 Hz for one second?. No explicit time information is stored in the file itself. 1 If the data in the file is arranged as multiple columns, you can provide a second argument (delimiter=char) that specifies what character (e.g., a comma or space) is being used to separate the values. This tells get fromtxt) to extract the data column-wise from the file and store it as corresponding columns in a 2-D array. 2 In the sampling process, the signal's magnitude is measured at regularly-spaced time intervals. For example, a sampling rate of 1 Hz means one measurement is taken every second, while a rate of 100 Hz means 100 measurements are taken every second. Once the data is loaded into the 1-D array variable, try these things in the console: a) What is the single line of Python code you can use to find the data type of the values in the array? b) Using your result from Part (a), what is the formal data type of the Sample ECG values? c) What is the single line of Python code you can use to find the length of the array? Note: If you are using Anaconda or Miniconda, the IDE window has a Variable Explorer that shows attributes of active variables in your workspace. d) What is the maximum value found in the Sample ECG array? e) At what array index is the maximum value located within Sample ECG? Hint: Look up the NumPy function argmax()
Step by Step Solution
There are 3 Steps involved in it

Get step-by-step solutions from verified subject matter experts